The NEW Inventory Valuation Report allows you to view and export your stock on hand quantities and costs from "as at" a point in time in the past, something not previously possible within Retail Express.
We recently introduced changes behind the scenes that allowed for the capture of before and after cost values for all transactions and stock movements in Retail Express. Retaining this before and after cost data provided the foundation for tracking true cost changes from a particular point in time. These new details, when coupled with the inventory quantity on hand, allow for the introduction of a point-in-time stock value report.
The Inventory Valuation report replaces the need to run certain reports at the end of key financial periods, such as the Stock Value Vs Sales report. This report will continue to exist, however, only the Inventory Valuation Report contains the "as at" date point in time concept.
Accessing the Inventory Valuation Report
Before You Begin
Ensure your user profile has access granted to the profile feature "Inventory Valuation Report" which is configured via
Staff > Profile Security
in the back office menu. You may need to log out and into the back office after changing the profile settings.
Generating the Report Results
- Navigate to Reports > Stock Reports > Inventory Valuation Report.

- On the Inventory Valuation Report page, Set your desired "As At" Date (defaults to the current date) and define any other fields you require.
The furthest back the "As At" date can be set is the 1st of April 2023. This is when cost tracking was introduced behind the scenes. The required cost data prior to this was not tracked and therefore the report can only be run from this date forward.

- Click Search to generate the results. You'll be automatically redirected to the Results tab. You can switch back to the Filters tab if you wish to edit the chosen search criteria.
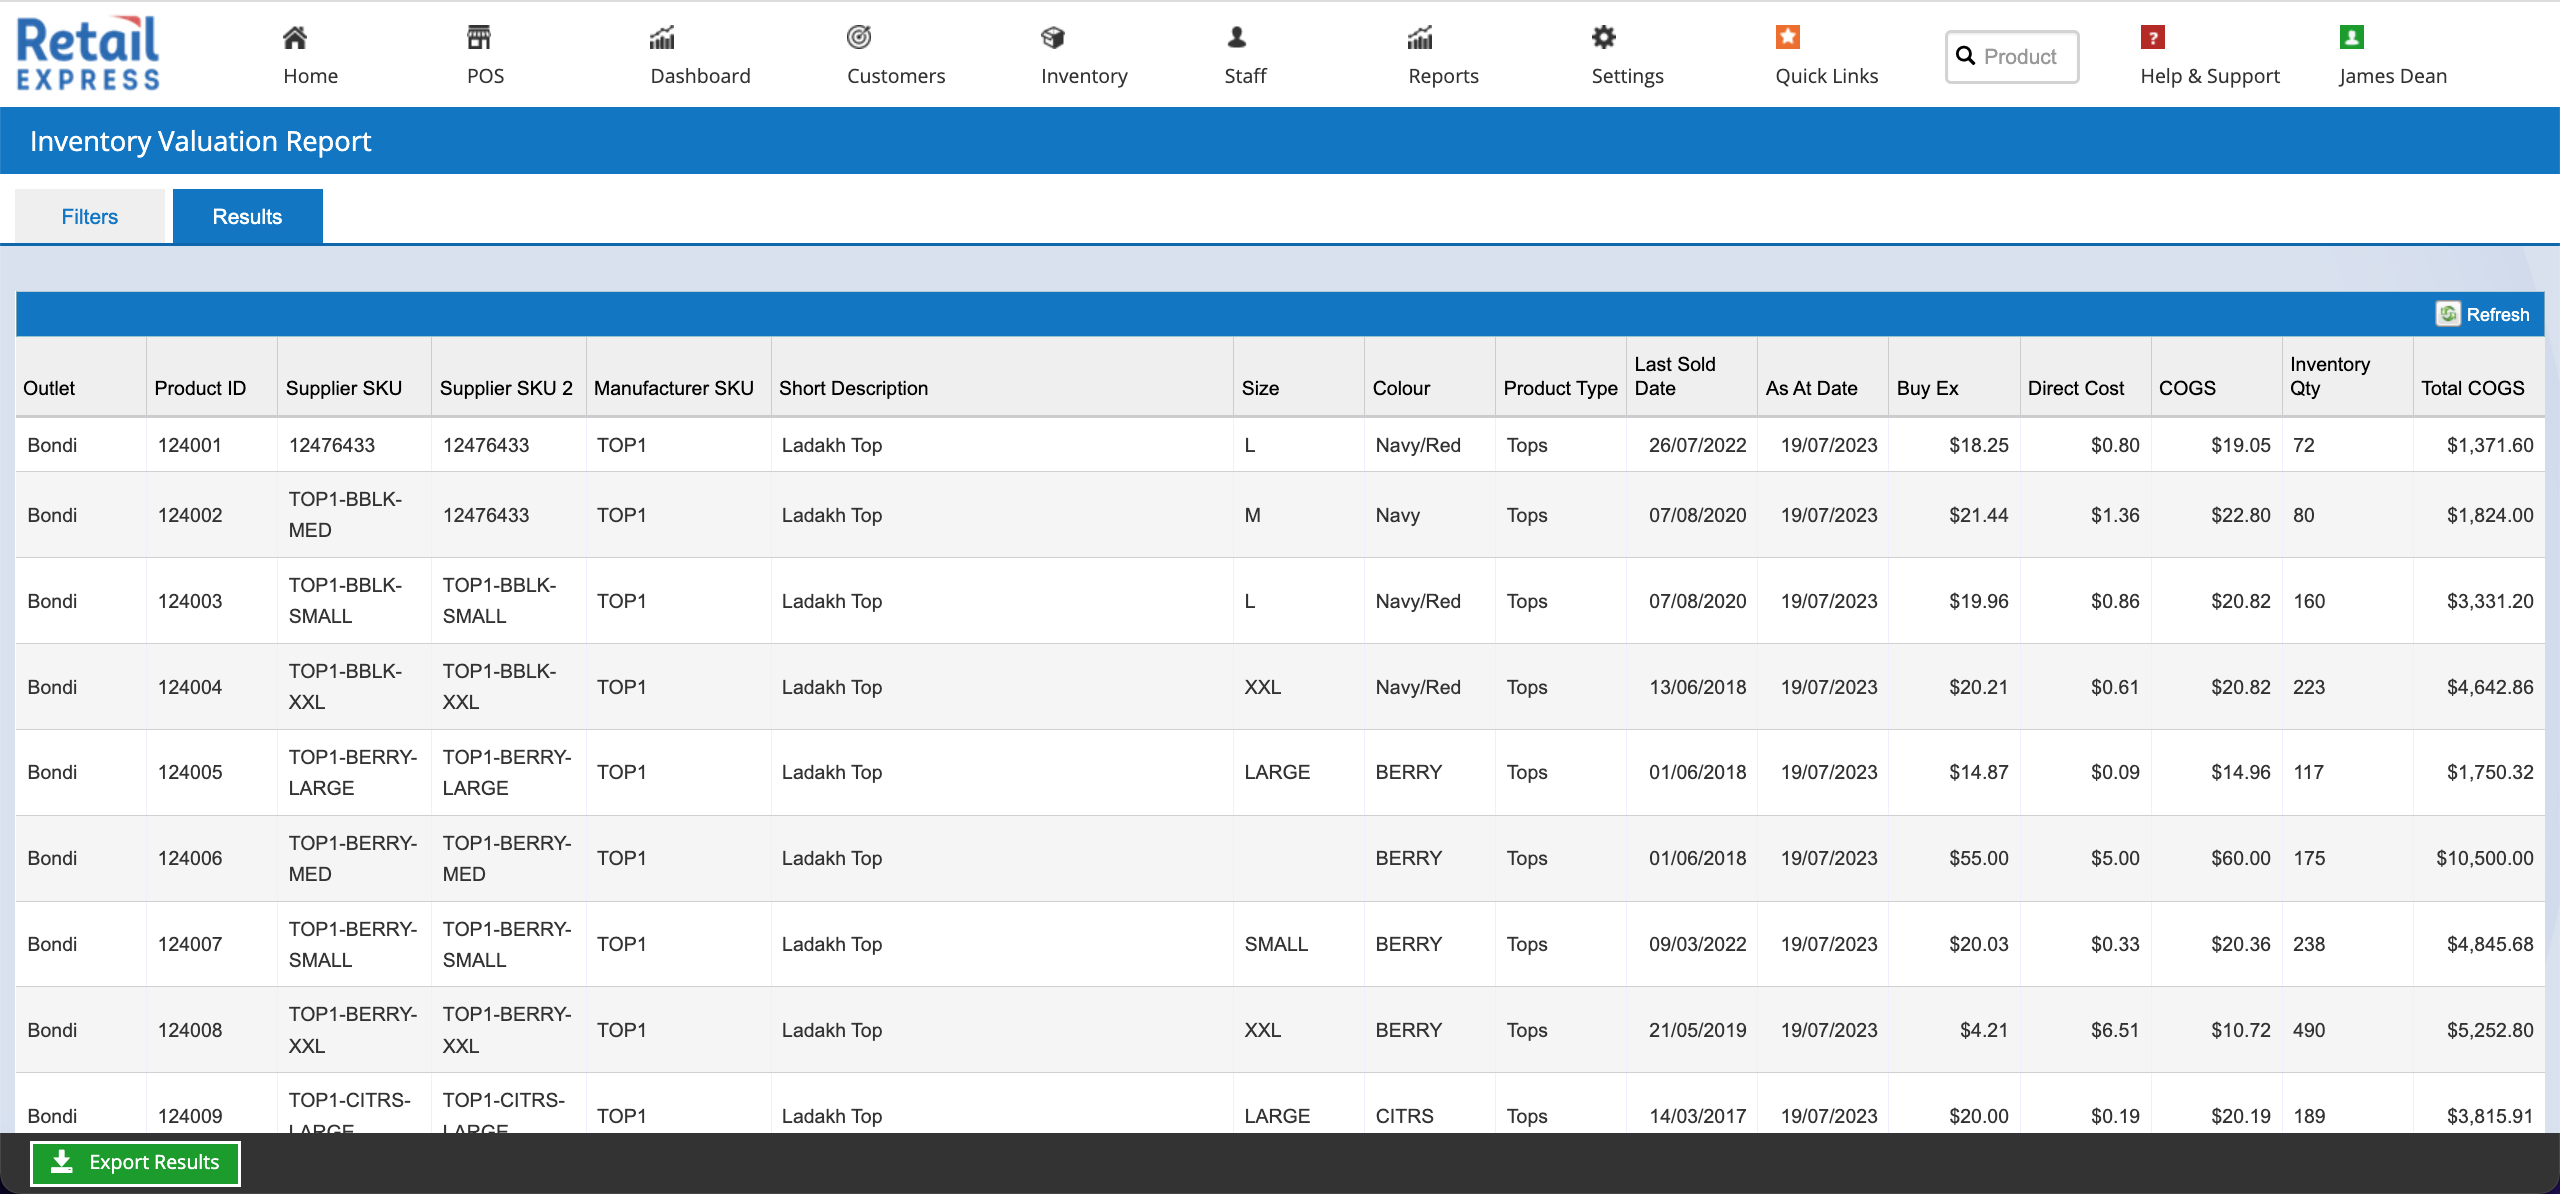
Viewing Report Results
The results include Outlet, Product Details, and key attributes as well as:
- The "As At Date"
- Buy Ex
- Direct Cost COGS (Buy Ex + Direct Cost from As At Date)
- Inventory Qty (From the As At Date)
- Total COGS (which is the Item COGS multiplied by the Inventory Qty.)
Notes:
Each product in the results is listed once for every outlet. This is because outlets can each have different prices and stock quantities from the "as at" date.
The package components are displayed in the results but the package products are not displayed.
You can sort the columns by clicking the column headers. The row at the bottom displays the averages and totals for the results displayed.
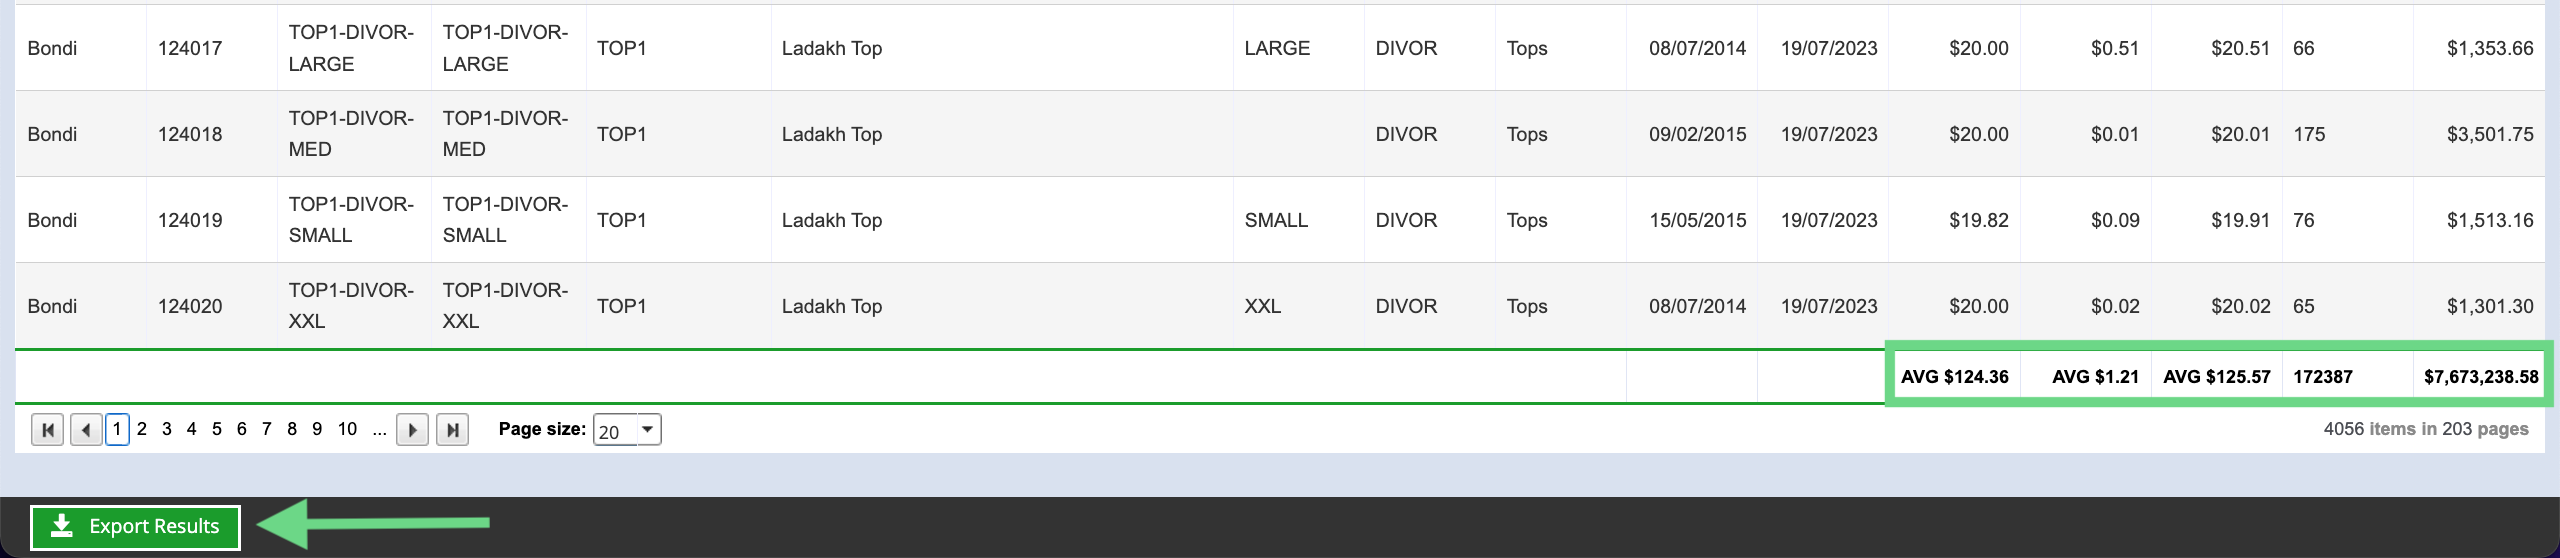
You can export the results using the Export Results button, which sends the job to the
Export Download Manager
Inventory Qty in this report is calculated using the SUM(Available, Allocated, Picked, Transit In, Received, Faulty, On Return) stock statuses.
You may select a different stock bucket inclusion list using the "Inventory Qty Includes" filter however the default values are what is typically considered "your stock" including items in transit on a stock transfer to your outlet.The costs and quantities values returned for a given date are from the last stock movement or cost change on that date.
That is, if you change quantities or prices several times during that day, the values shown will be the most recent (the last change you made that day) - similar to the concept of "As at the Close of Business".