Franchise Connect brings all of your Franchisee's Retail Express data into a single location for high level reporting. Franchisors have visibility for reporting across all Outlets via the Master Franchisor Database. Included are powerful filtering options:
- Franchisee - target specific Franchisees (as determined by a single Retail Express url)
- Global Products Only
- Global Suppliers Only
Reports available within Franchise Connect may look similar to standard Retail Express reports. However, we advise that Franchise Connect and Retail Express are different systems, designed for differing purposes, and as such should not be compared.
Click each report title to view more information.
Franchise Connect is an additional add-on to Retail Express; for more information please contact our Sales Team by email at sales@retailexpress.com.au or by phoning 1300 732 618.
Use the Customer Activity Report to ensure customer contact is engaging and relevant. Apply filters to target your Customers, and create incentives to drive customer sales ;in-store and online.
- Navigate to Reports > Customer Activity Report
- Apply the required filters
More filters are available by clicking the Refine Search and Refine By Attributes tabs
- Click Search
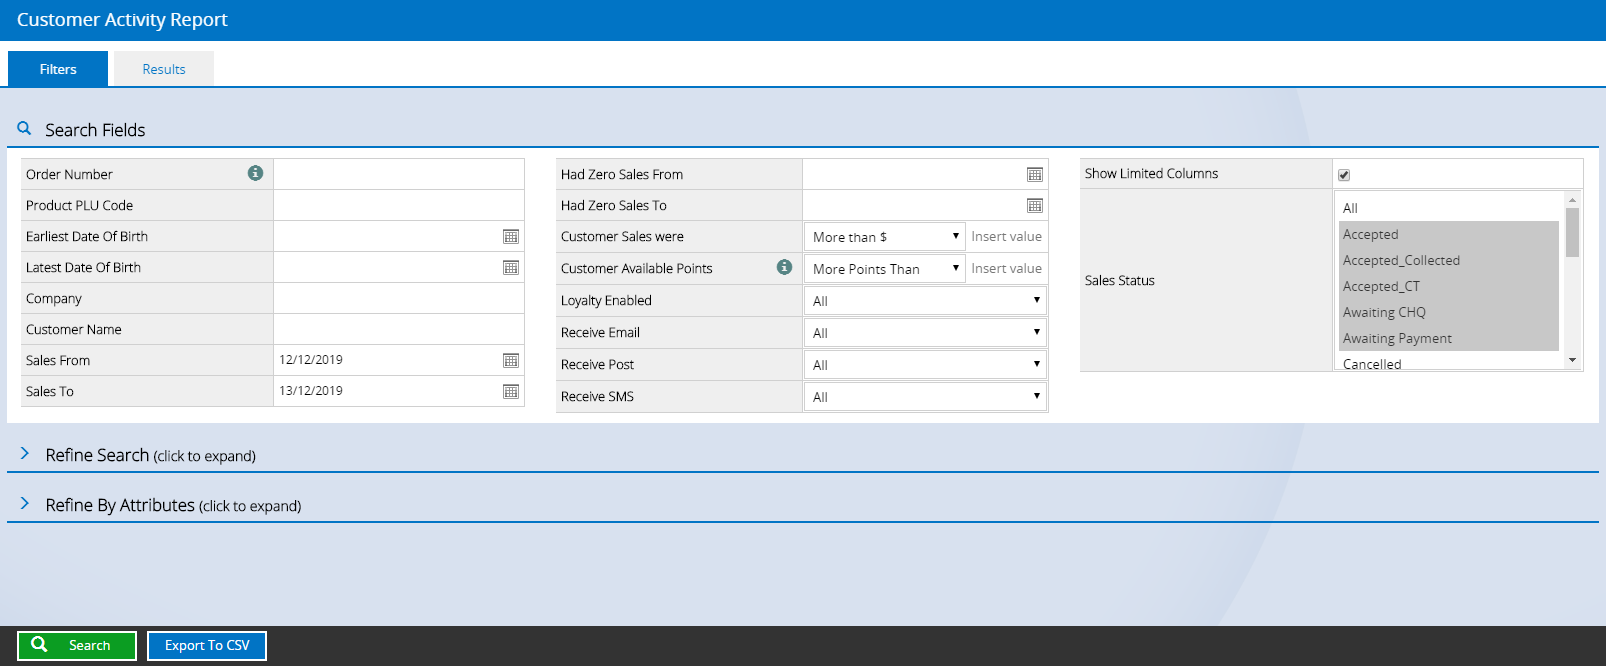
For Users familiar with standard Retail Express report fields, the below filters are not available:
- Customer Number - due to potential duplications across multiple Franchisees
- Sales Person - due to the sheer number of potential Users when reporting across all Franchisees
- Survey Segments - due to the sheer number of potential Survey Segments when reporting across all Franchisees
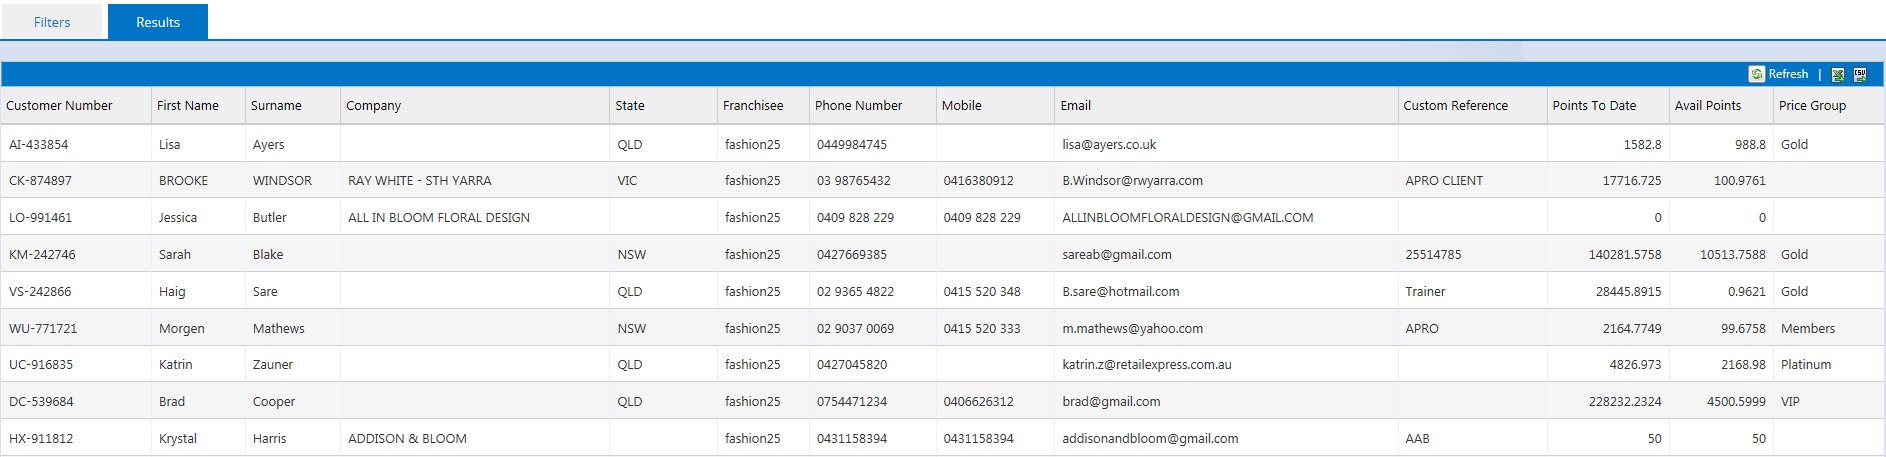
Results can be sorted directly within the page. Click any column header to sort into ascending or descending order.
Alternatively, click the Export to CSV option to export the results to Excel.
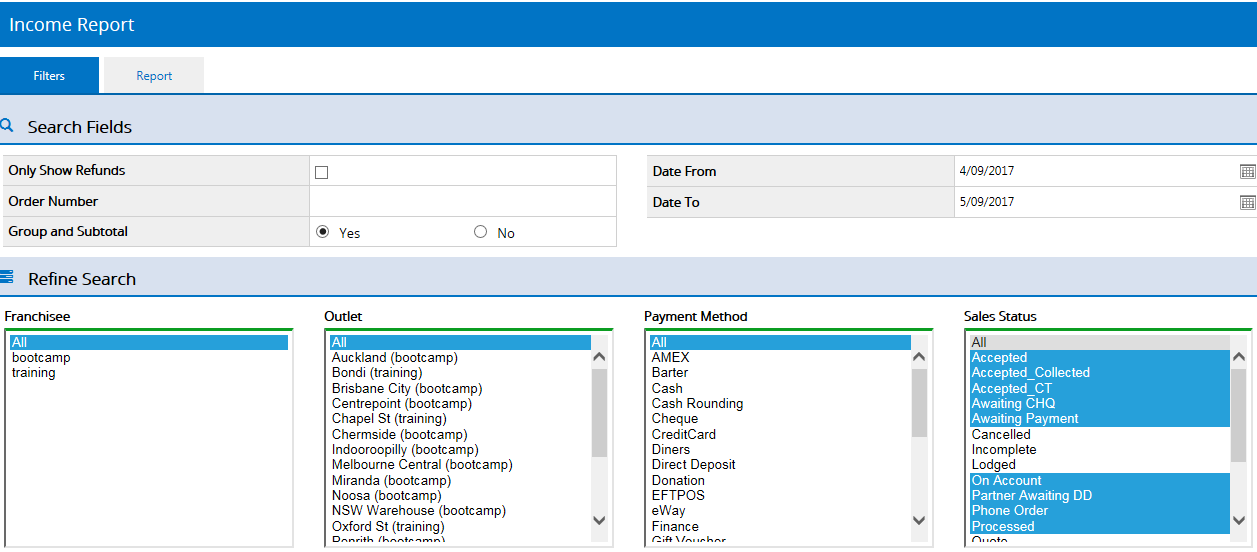
The Income Report reports on
income
received at POS during a specified date and time range.
The Income Report would be the 'go-to' report for reviewing the level of spend for negotiations with EFT providers or banking institutions.
Reports can be filtered by individual Franchisee or right down to the Outlet at which payment was received.
Income reporting values differ from Sales values reporting. Find more information about the differences here : Why don't the Income Report values match the Sales Report values?
To access Report, Go to : Reports > Income Report
For Users familiar with standard Retail Express report fields, the below filters are not available:
- Franchisee - target specific Franchisees (as determined by a single Retail Express url)
- Global Products Only
- Global Suppliers Only
Apply the required filters > click Search.
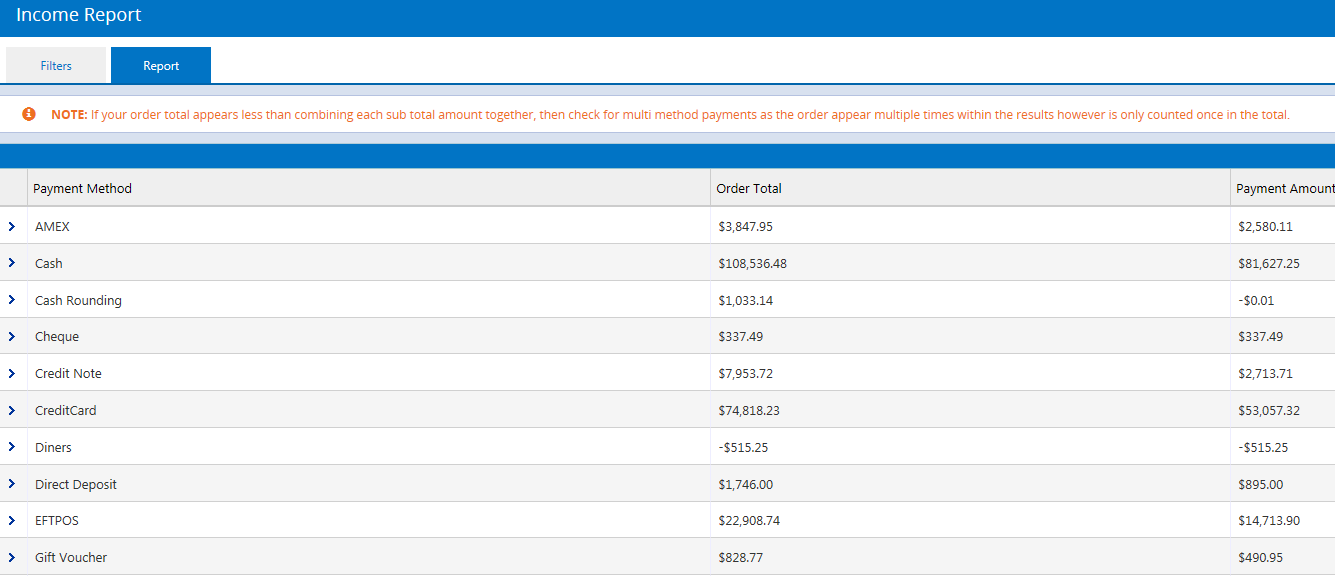
Results are displayed as a Summary by Payment Type. To expand each Payment Method and view individual Orders, click the arrow.
Results are able to be exported to Excel.
If your order total appears less than combining each sub total amount together, then check for multi method payments as the order appear multiple times within the results however is only counted once in the total.
The Product Sales Report displays simultaneously: Stock level (Qty Available), Qty Ordered and Qty Sold for a selected date range.
The date range selection only affects sales results. The Stock Value is always reported as at the time of running the report.
To access Report, Go to : Reports > Product Sales Report
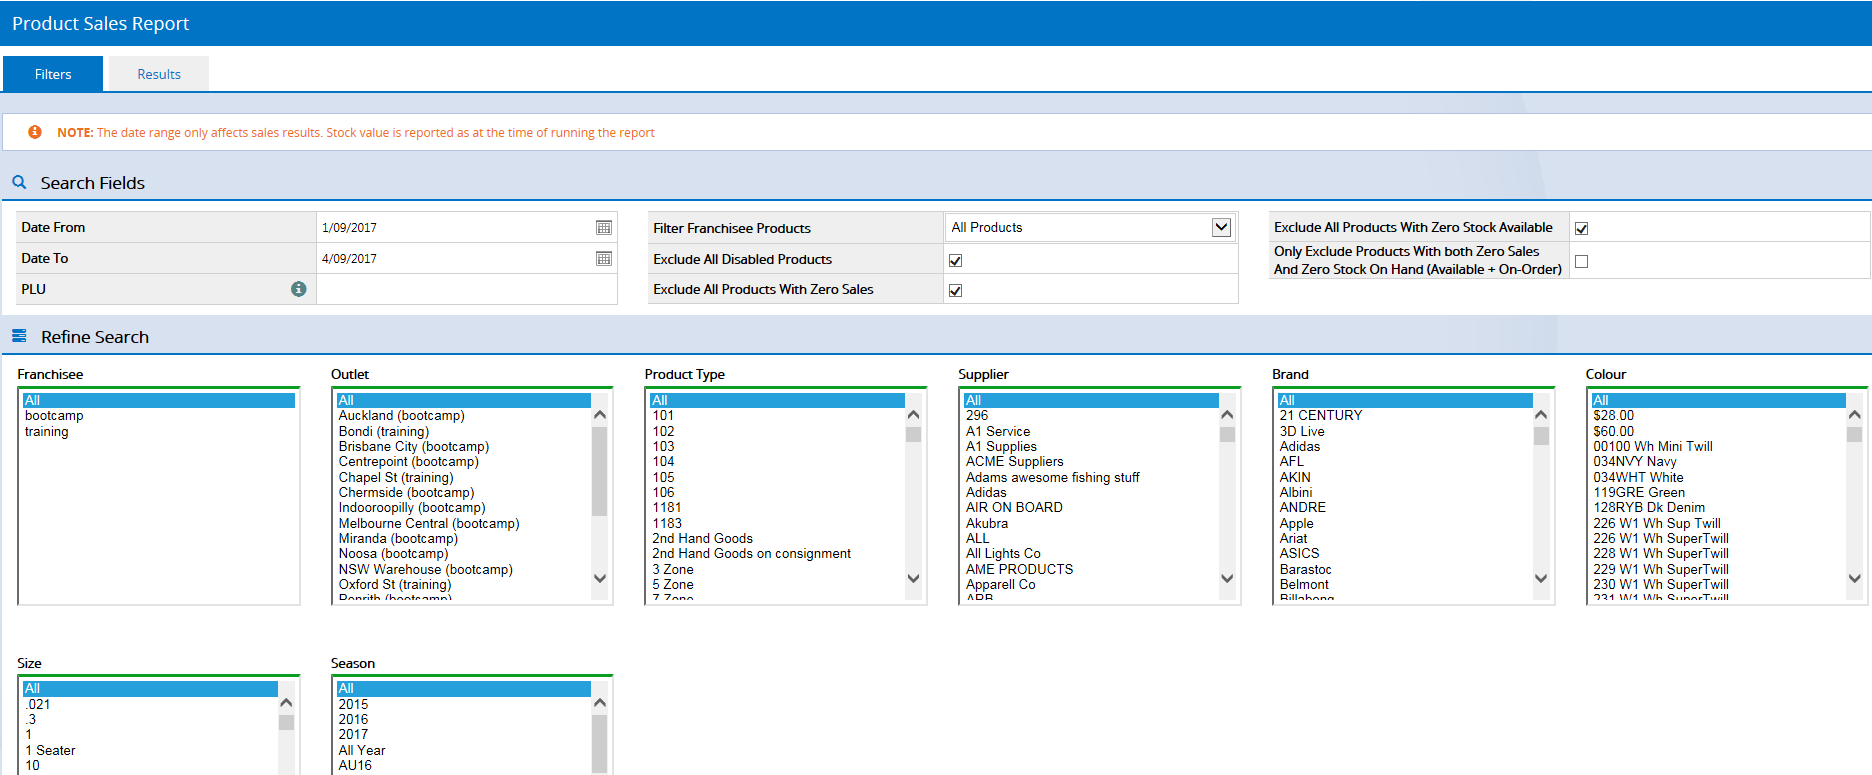
Apply the required filters > click Search.
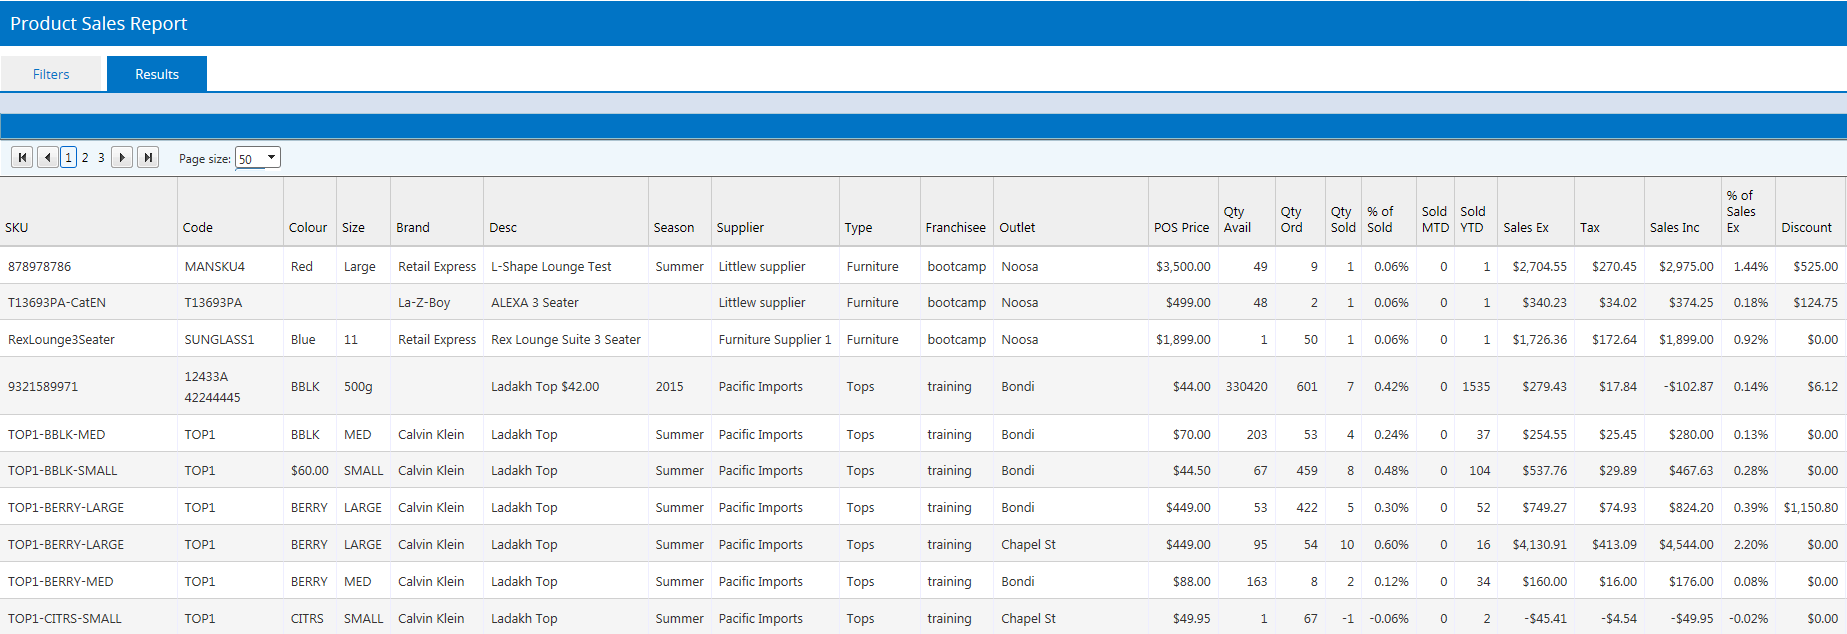
Results can be sorted directly within the page. Click any column header to sort into ascending or descending order.
Alternatively, export to Excel.
To access Report, Go to : Reports > Sales Report
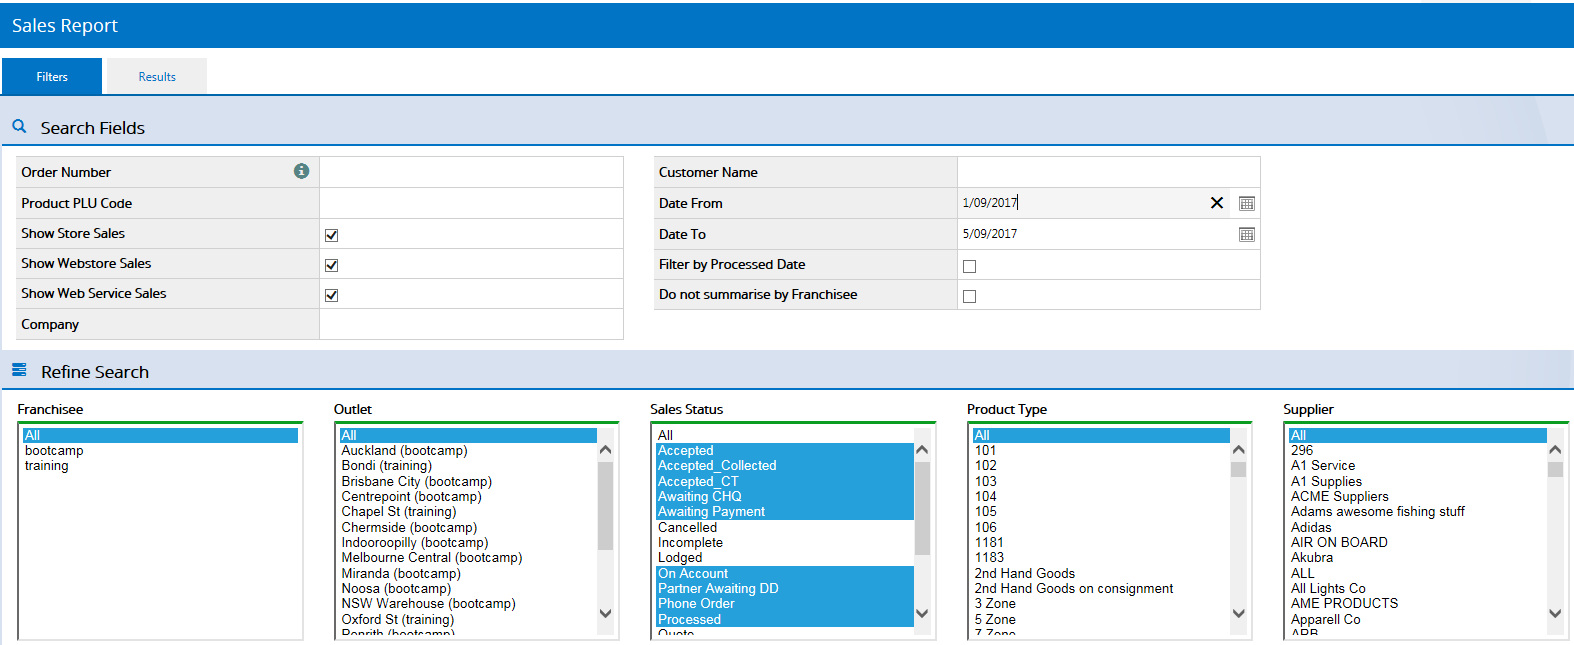
For Users familiar with standard Retail Express report fields, the below filters are not available:
- Customer Number - due to potential duplications across multiple Franchisees
- Sales Person - due to the sheer number of potential Users when reporting across all Franchisees
Apply the required filters > click Search.
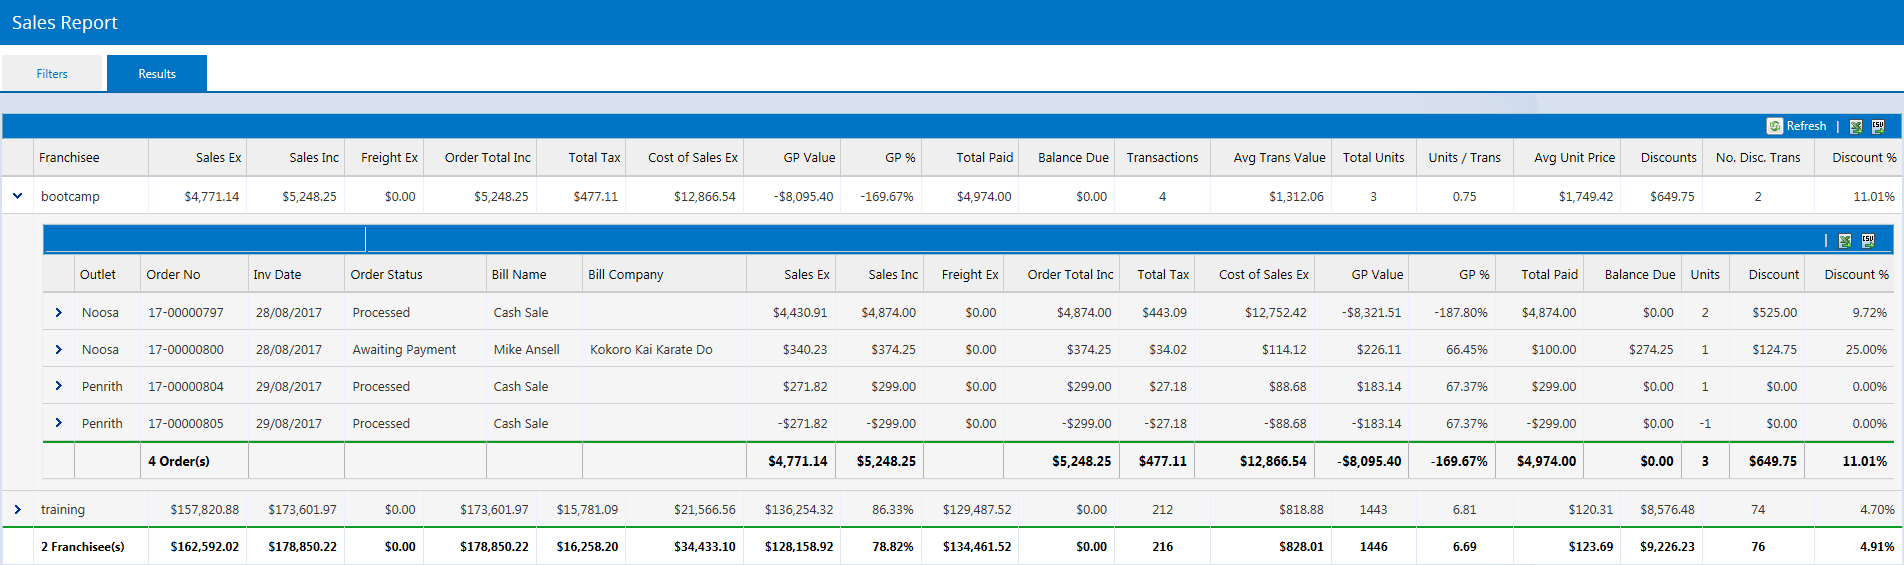
Results are automatically grouped by Franchisee and displayed as a summary. Individual Orders can be viewed by expanding the section.
Results are also able to be exported to Excel.
Sales reporting values differ from Income values reporting. Find more information about the differences here : Why don't the Income Report values match the Sales Report values?
Sales value reported in the Sales Report will not necessarily display the same values as the Stock Value vs Sales Report, and these reports should not be compared to each other.
Filter sales by Supplier, Product Type or Brand over a selected date range.
To access Report, Go to : Reports > Sales Summary Report
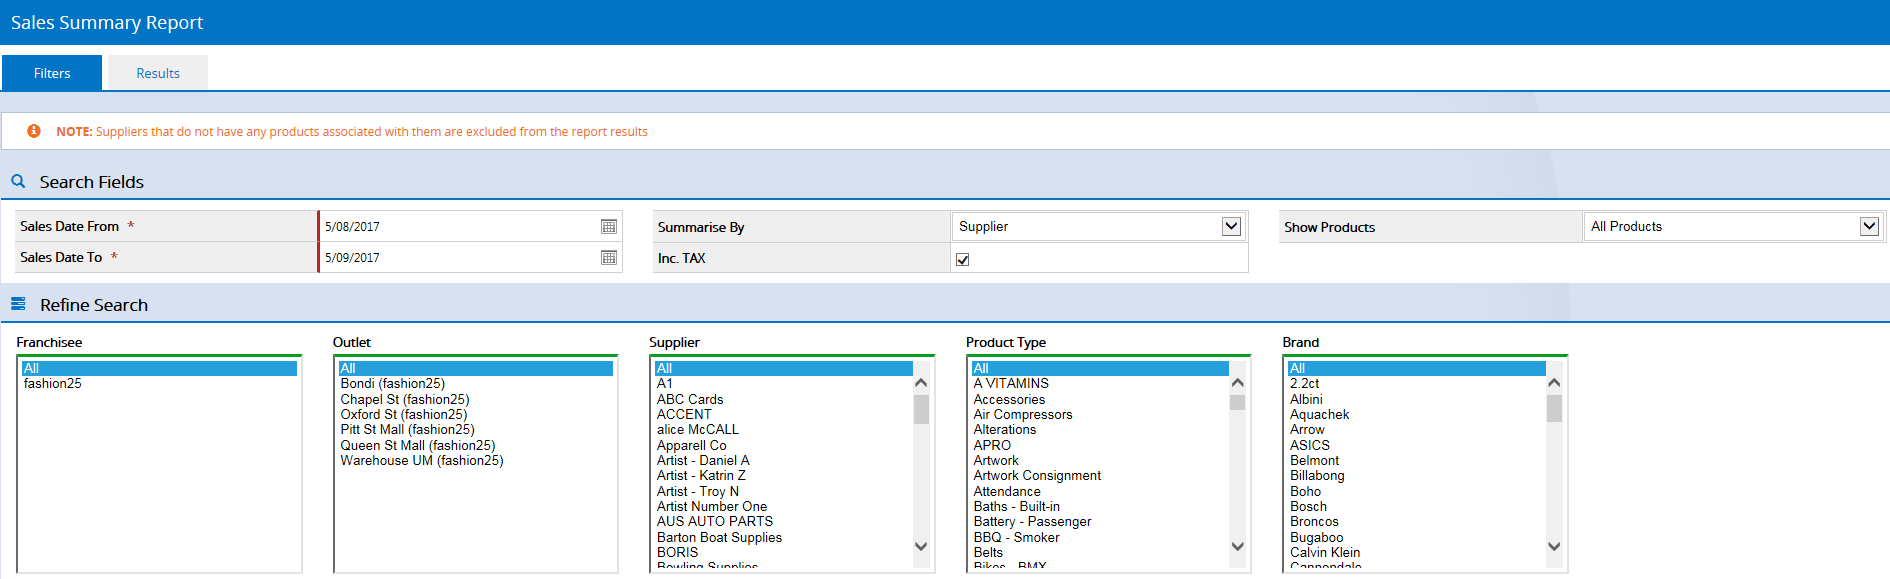
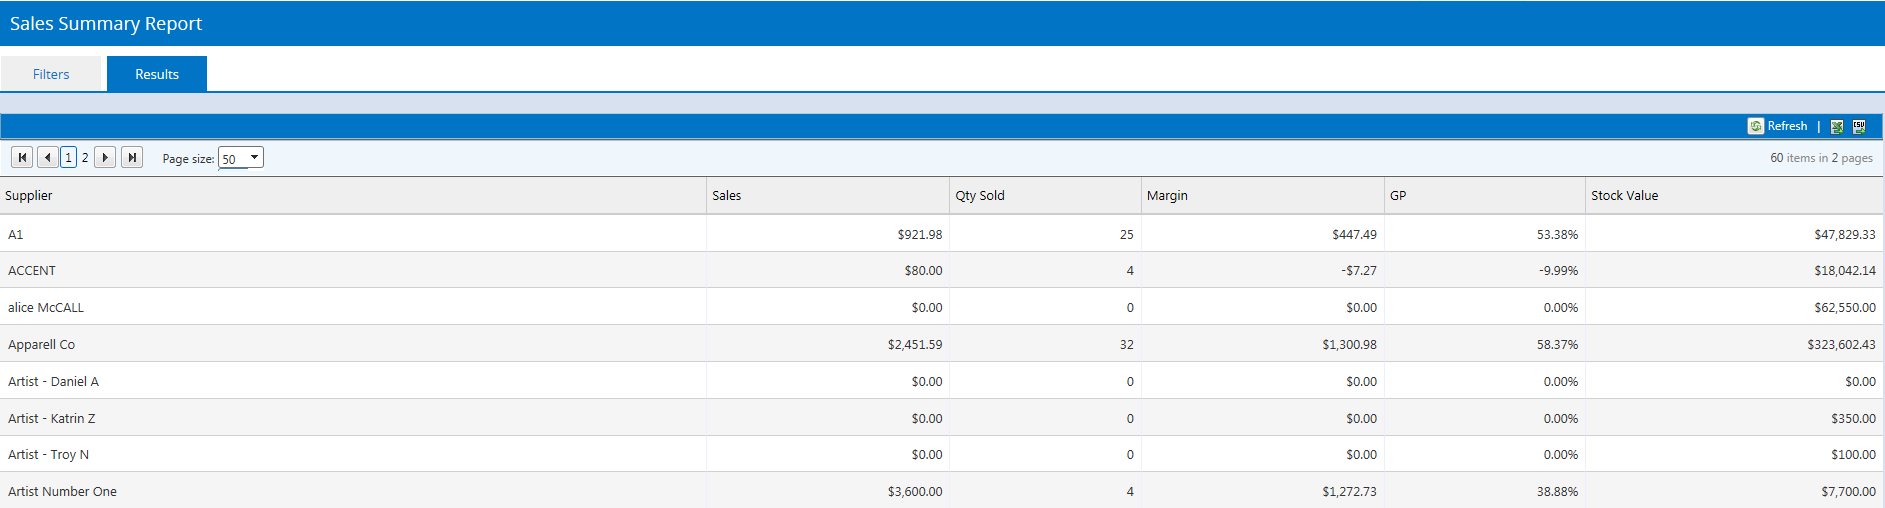
As with most reports, this report is able to be Exported into Excel.
Suppliers that do not have any products associated with them are excluded from the report results.
The Stock Value Vs Sales Report is the recommended report for Inventory Valuation information.
This 3 x part report, shows Purchase Order (PO), Sales, and Stock Value information in a combined format. The report simultaneously displays Current Stock Value, Value of Sales (over a specified date range), and Value of Purchase Orders (over a specified date range).
The Report can by grouped by either Product Type or Outlet and is designed to provide a summary of this information.
To access Report, Go to: Reports > Stock Reports > Stock Value Vs Sales
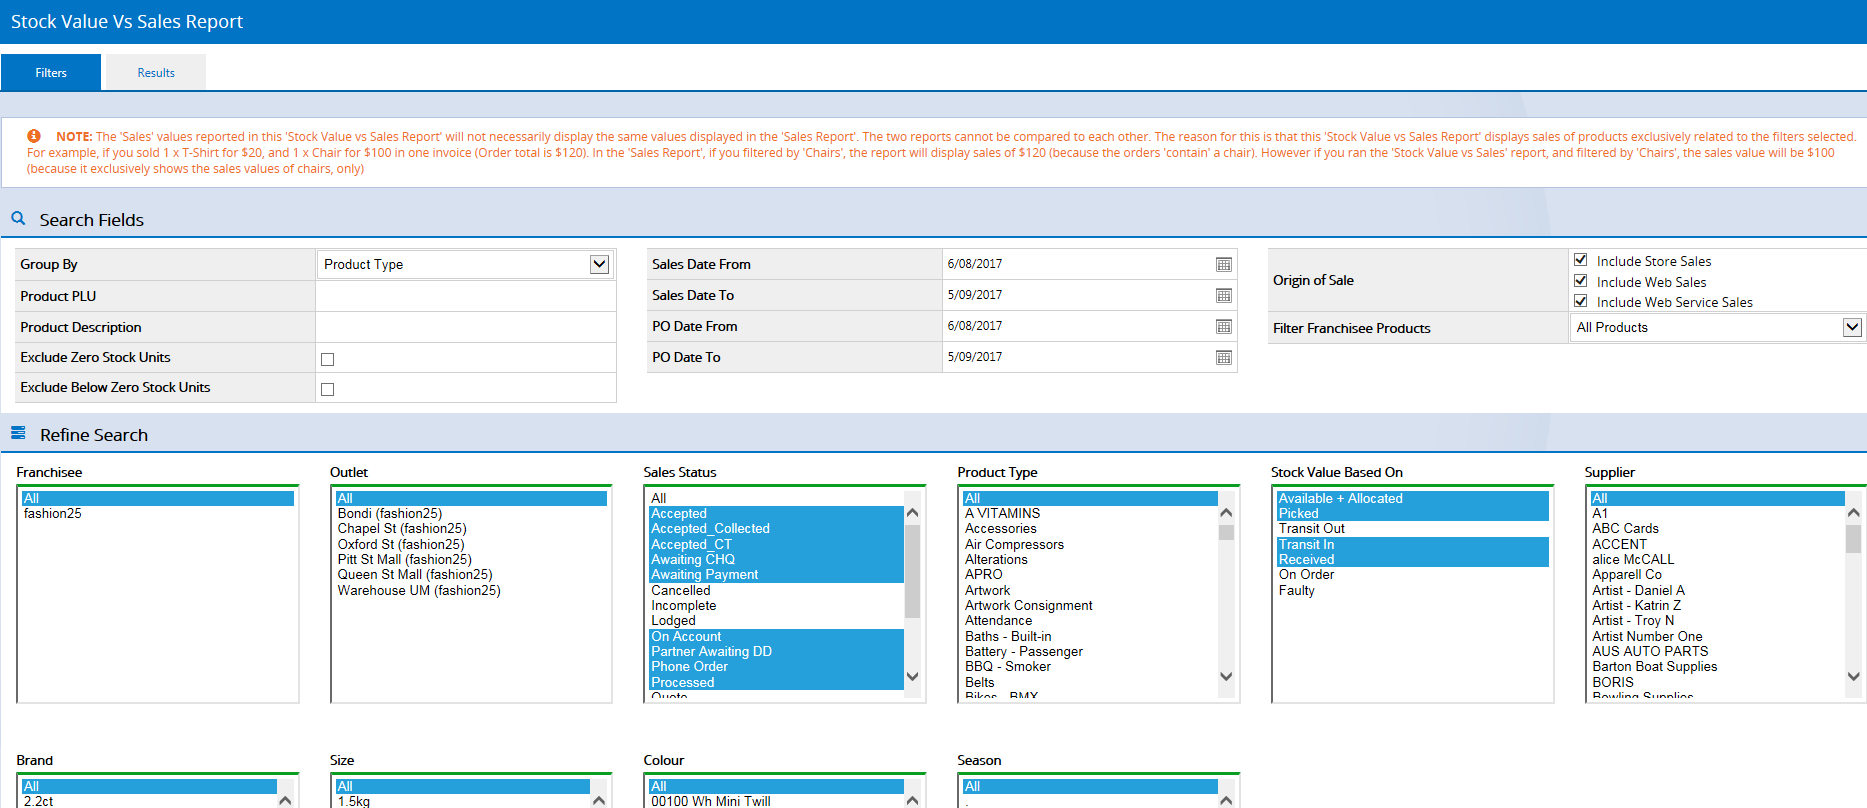
Product PLU
Enter specific Product PLUs (ManufacturerSKU or SupplierKSU) to filter information. To search for multiple PLUs separate them using a comma.
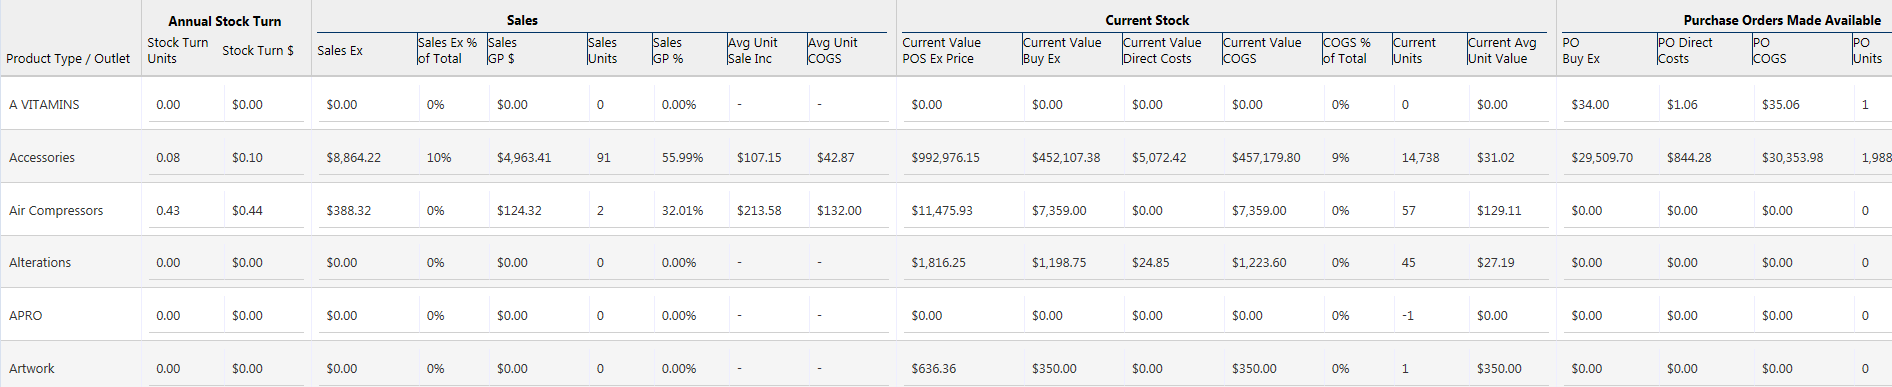
Hover over the column headers to view the calculation for that field.
Sales values reported in the Stock Value vs Sales Report will not necessarily display the same values as the Sales Report and these reports should not be compared to each other.
As with most reports, this report is able to be Exported into Excel.
Filter and assess details of Non-Global Suppliers that regularly appear in Franchisee activity reports. Use this information to make decisions and negotiate with Suppliers regarding group discounts.
The Supplier Performance Report is custom designed for Head Office, as such it is not currently available as a report for standard Retail Express Users.
This report captures and displays data compiled in weekly blocks. This is a pre-configured setting which displays each Weeks Sales results as a number, based on the calendar year.
To access Report, Go to : Reports > Supplier Performance Report
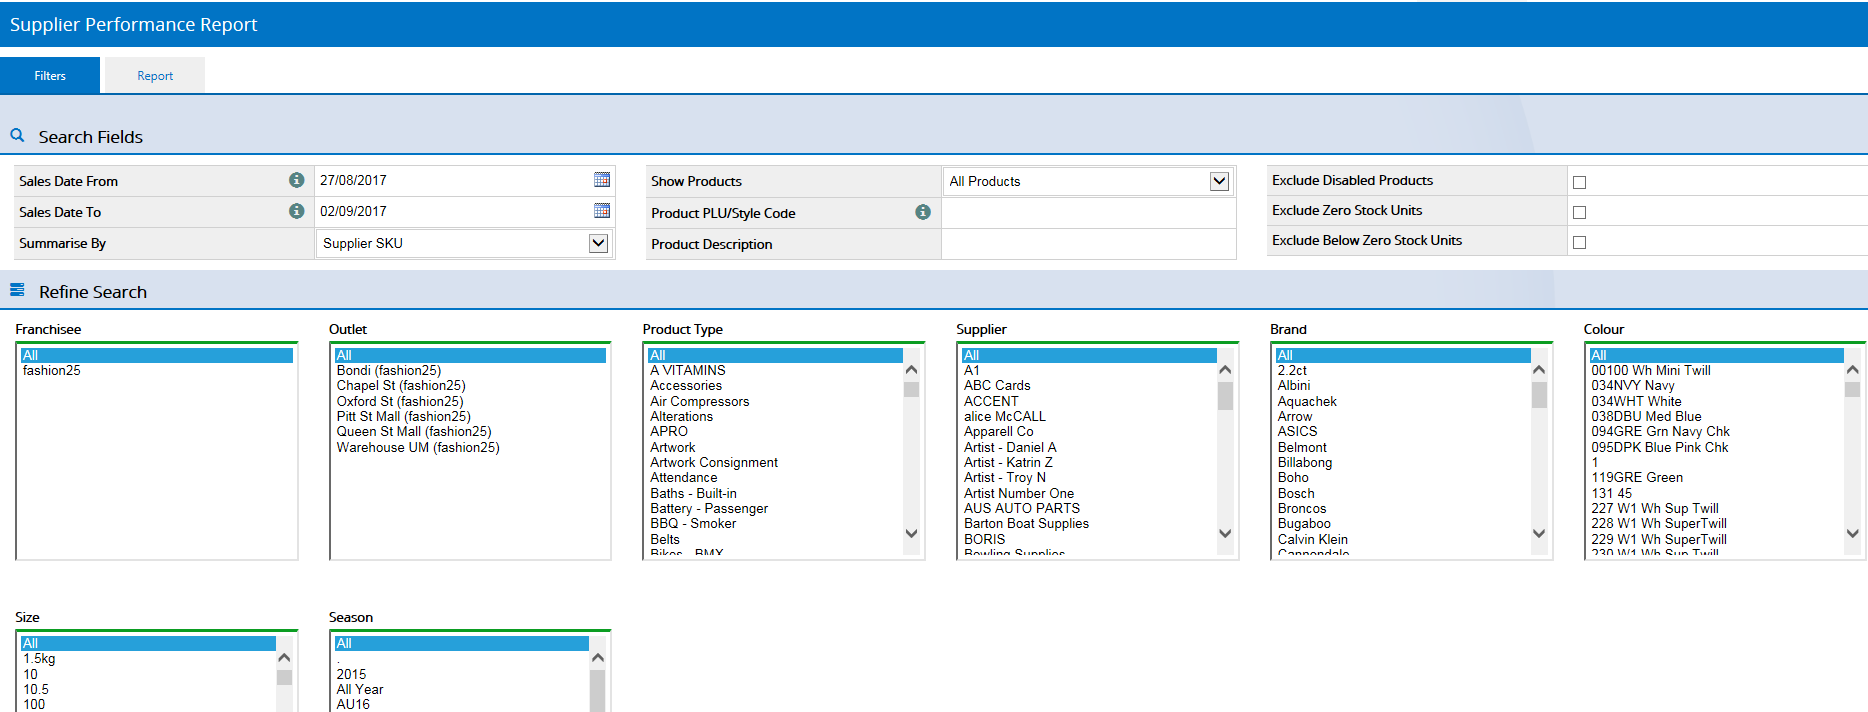
click any column heading to sort into ascending or descending order.
During initial setup, you will be required to wait until the first full week of data synchronisation has occurred before accessing relevant results. Information is not populated with sales data that occurred at the Franchisee level prior to their connection to Franchise Connect.
As with most reports, this report is able to be Exported into Excel.
Want more information? Find related articles here:
Franchise Connect - Getting Started