You can analyze product performance in Retail Express by accessing style-specific sales and inventory reports, helping your retail management make data-driven decisions about product assortment and purchasing. This capability provides insights into how individual product styles perform across locations and time periods, which helps identify bestsellers, slow-moving items, and trends that inform inventory strategy.
Setting up regular product performance reviews enables your retail operations to optimize inventory investment, helping identify which styles to reorder, promote, or discontinue. This helps retail businesses maintain profitable product mixes by understanding which items drive sales and which may require price adjustments or clearance strategies.
Find Related articles at the bottom of this page
From time-to-time it's important that you check in on your sales to understand how your products are performing, and to prepare for peak sales periods. For example, you may need to ensure you have enough stock of your best sellers (you can even use the Stock Replenishment feature to automatically calculate this for you to easily create Purchase Orders or Transfers).
If you're looking at running a Promotional Campaign, especially in peak periods like Christmas, knowing which products to promote can bring in a lot of additional sales.
Within Retail Express there are 4 particular reports that are ideal for reporting on product performance. Find details on each of these reports below.
Product Sales Report
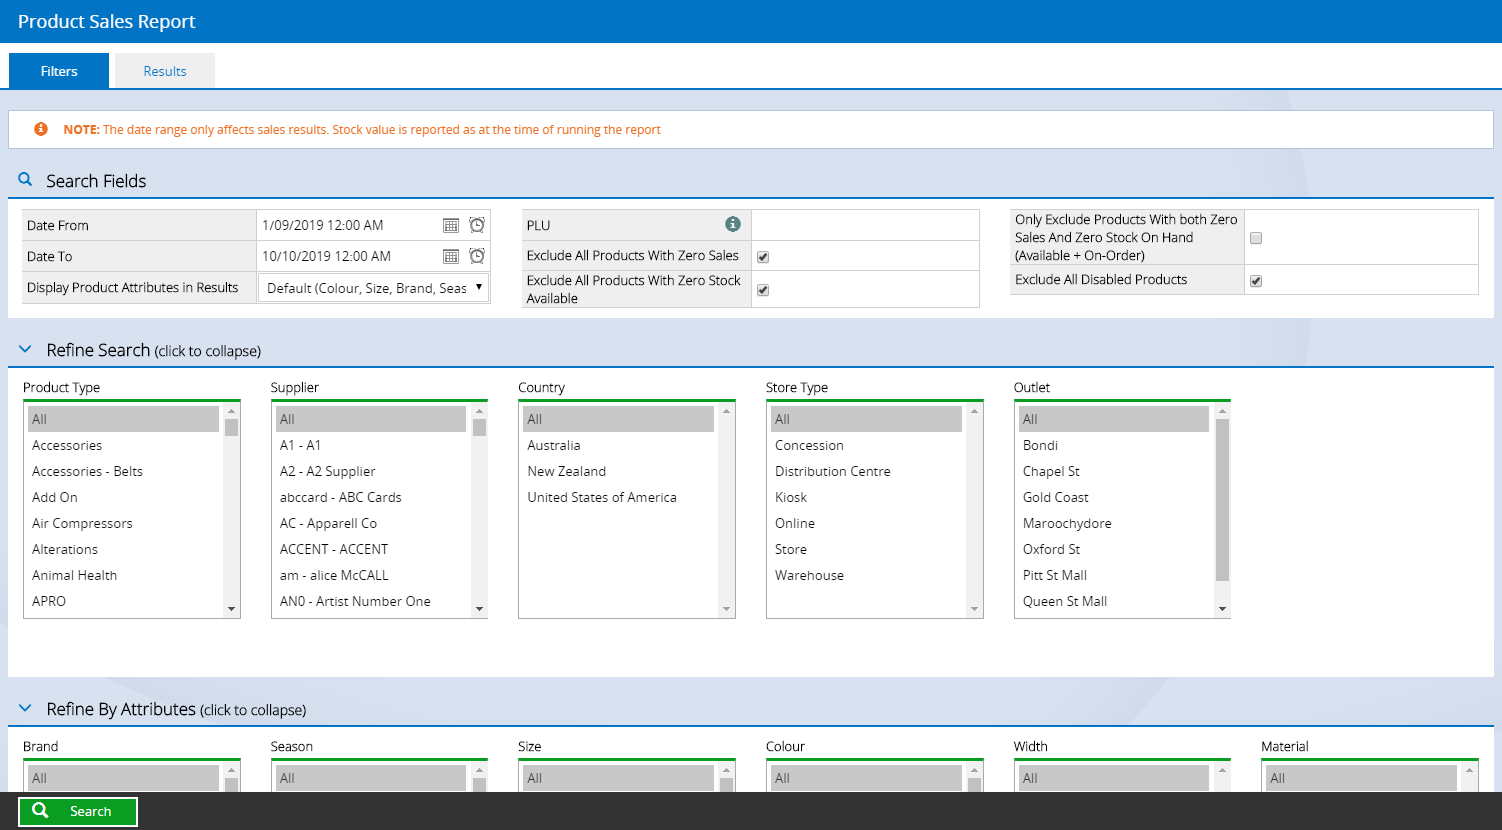
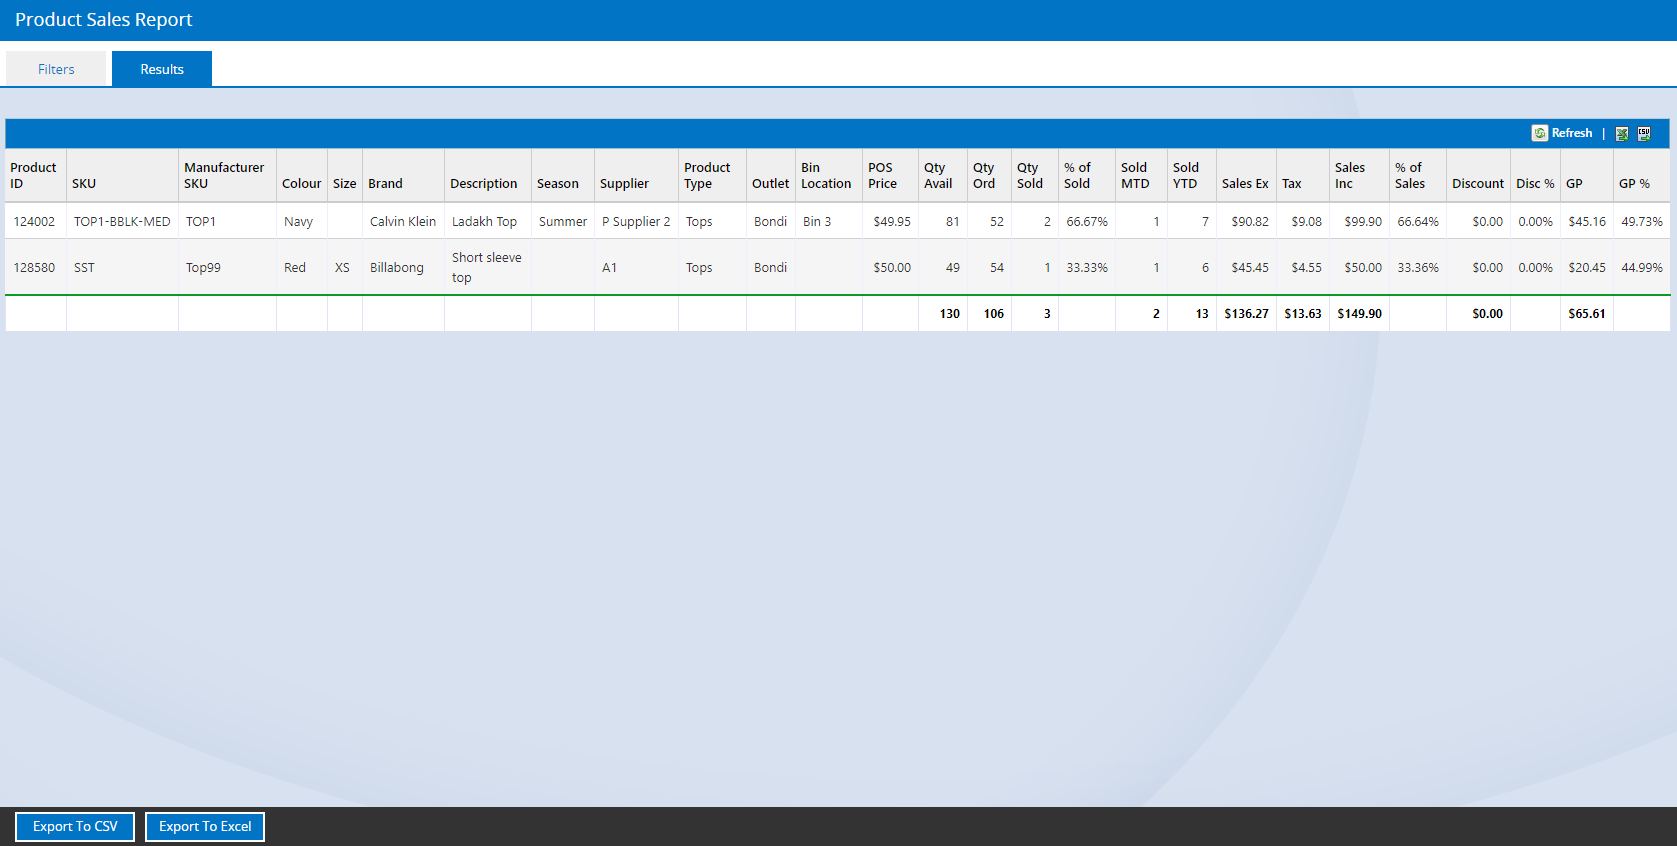
The Product Sales Report will show you how a particular product has been selling withing a given date period, your current inventory level, discounts given and your Gross Profit.
Note:
- The maximum date range is 12 months
- The date range selected only affects sales results
- Stock value is always reported at the current value at the time of running the report
- The report can be Exported to Excel for more detailed analysis
Using the filters you can exclude products with no sales, products that have zero stock available, or products that have had no sales and zero stock available (i.e. you're unlikely to order any more of these).
To access the report, navigate to Reports > Product Performance > Product Sales Report. For more detailed information on this report, view the Product Sales Report article.
Back to top
Item Sales Report
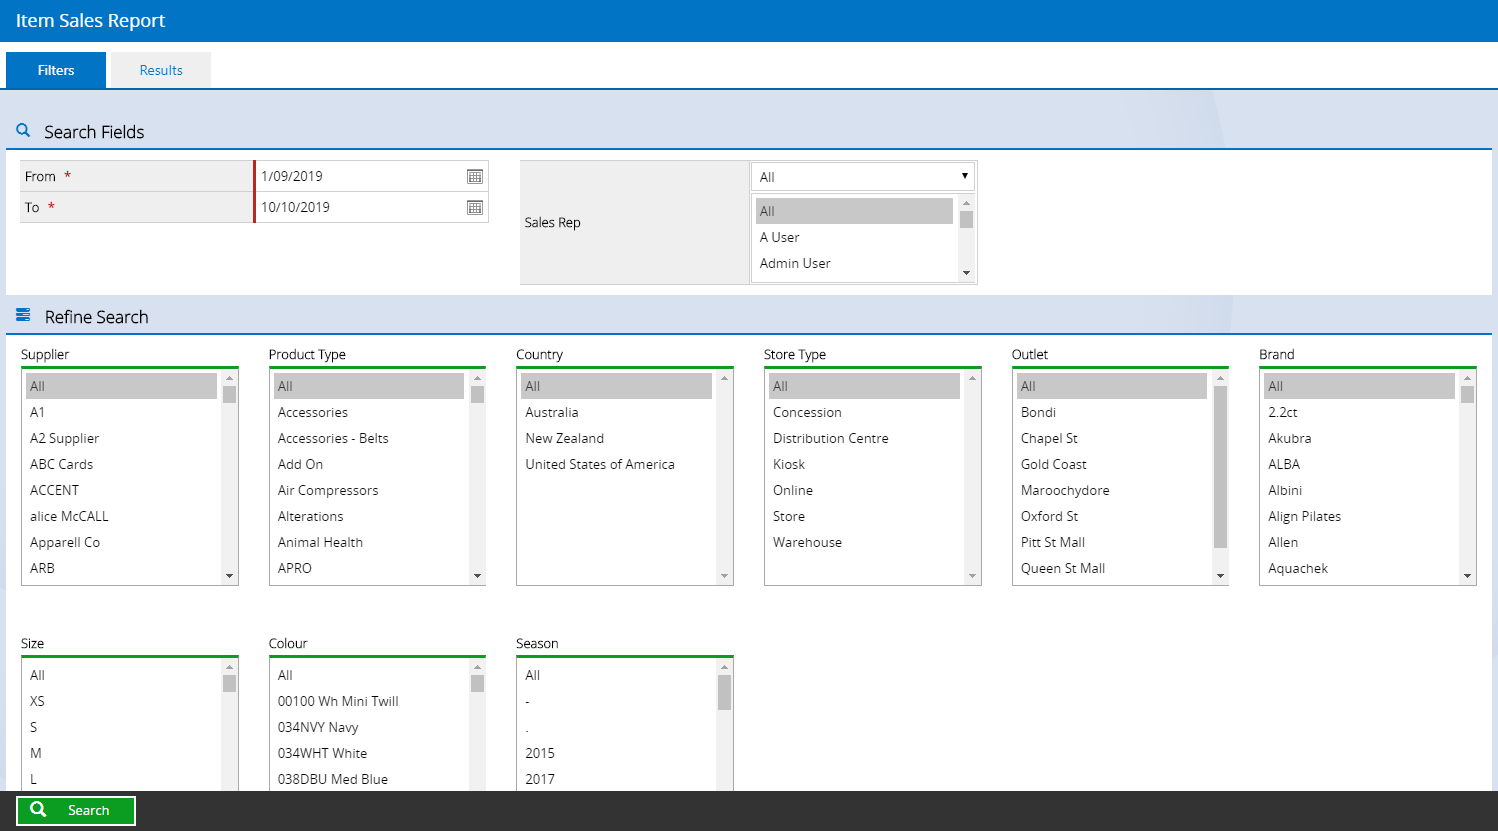
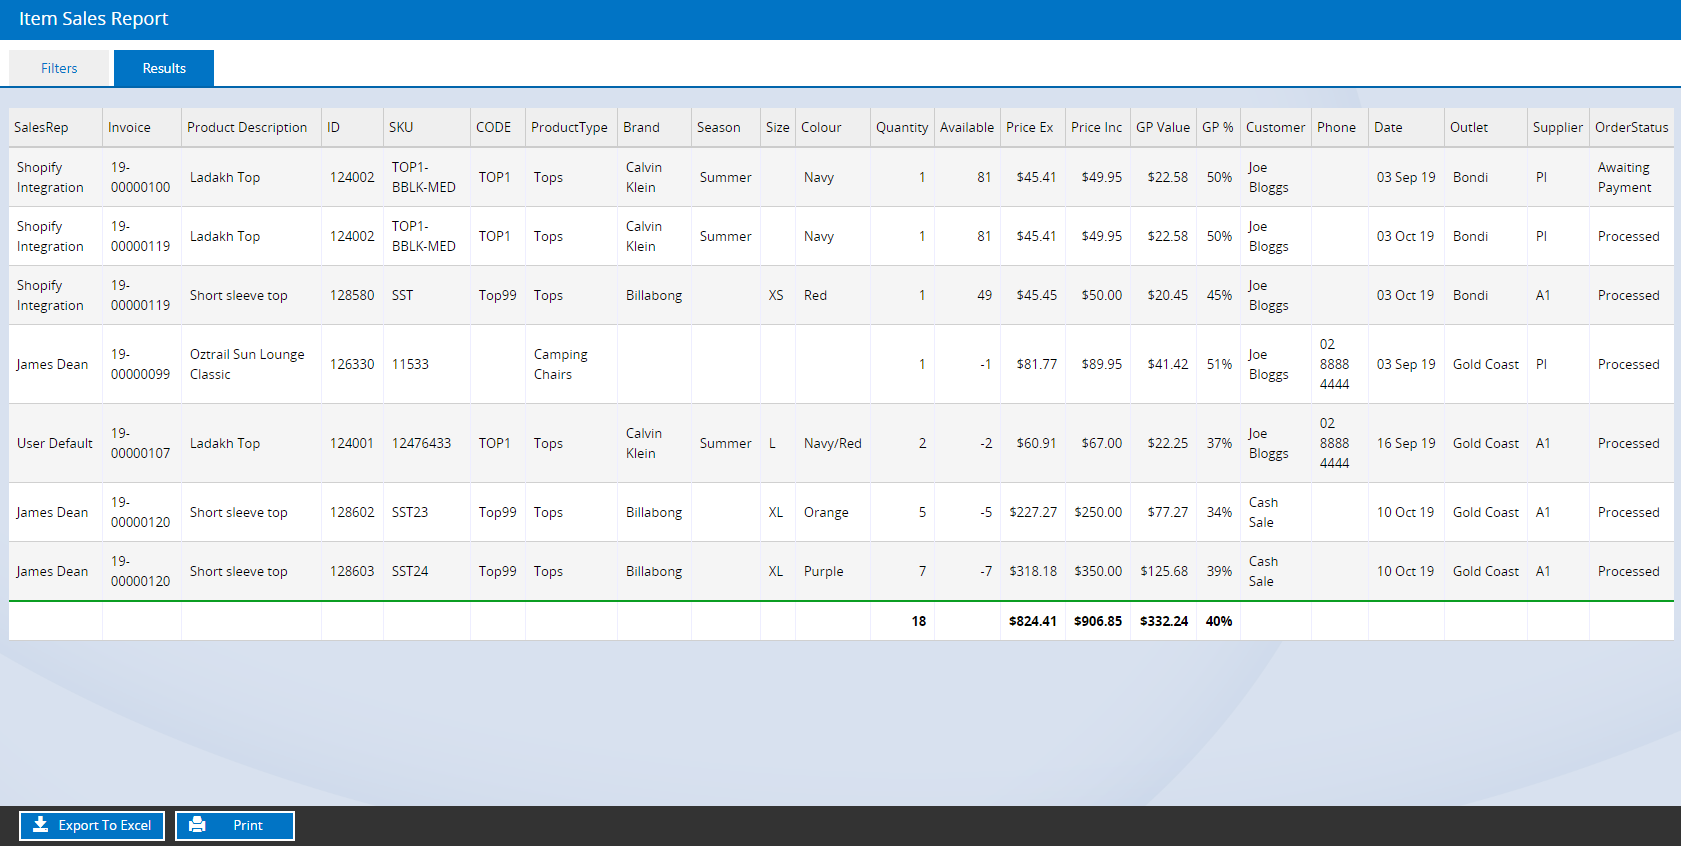
Compared to the Product Sales Report, the Item Sales report displays results by the Invoice Number, and does not include the current inventory levels.
This report is great for when you want to see the Sales data at a more granular level e.g. if running a promotion for a particular brand, running the Item Sales Report will provide you with a list of all customers that purchased that specific brand. Combining this with the Promotional Campaigns feature you could even provide those customers with a unique discount code.
📋 Note: You cannot specify a PLU Code within this Report - all sales within the date range containing products matching the filters will be displayed.
The Item Sales Report can be accessed via Reports > Product Performance > Item Sales Report. For more detailed information refer to the Item Sales Report article.
Back to top
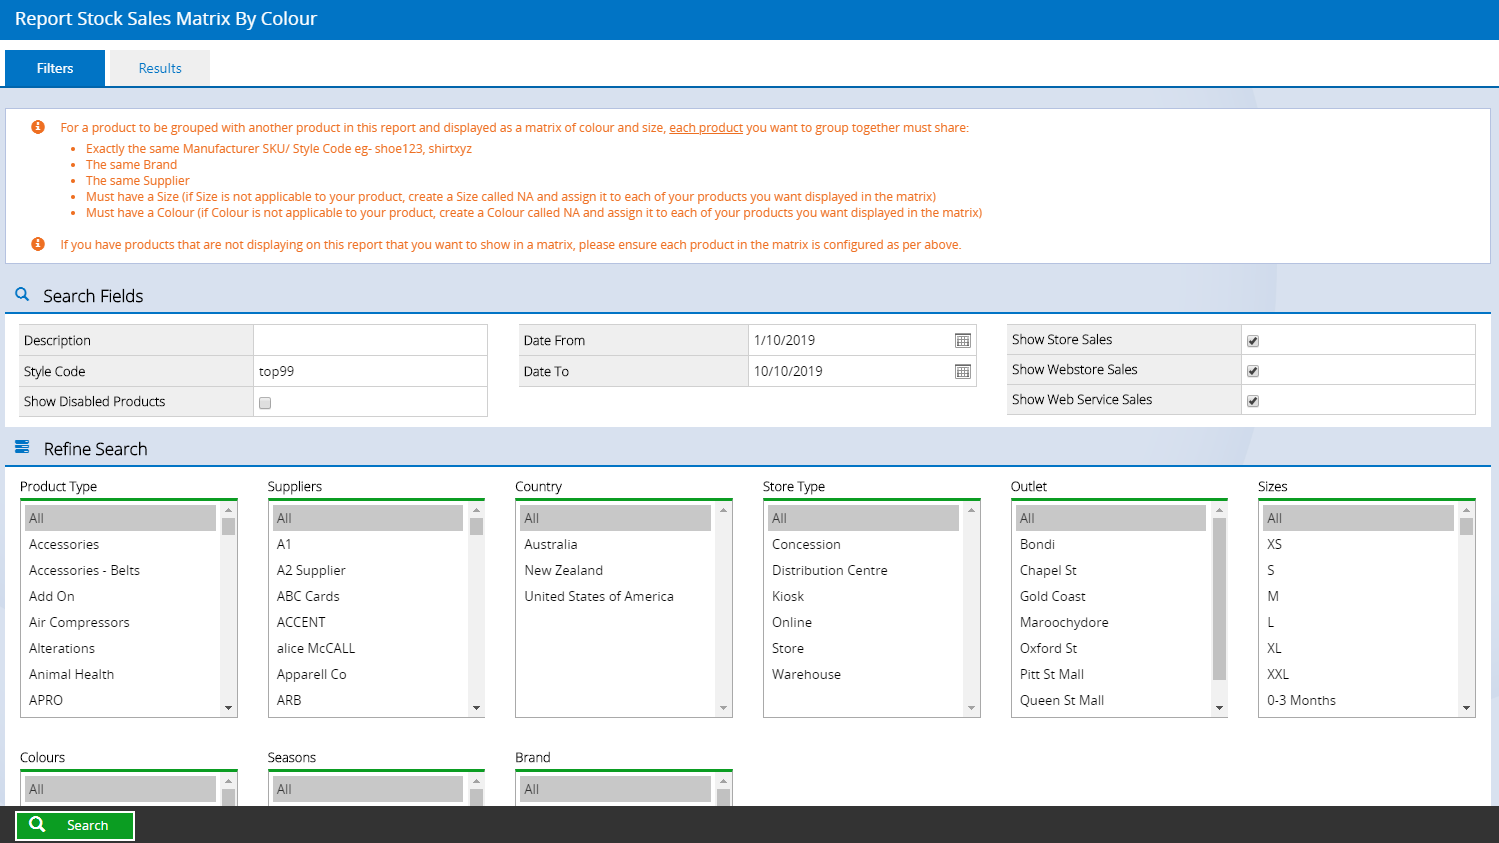
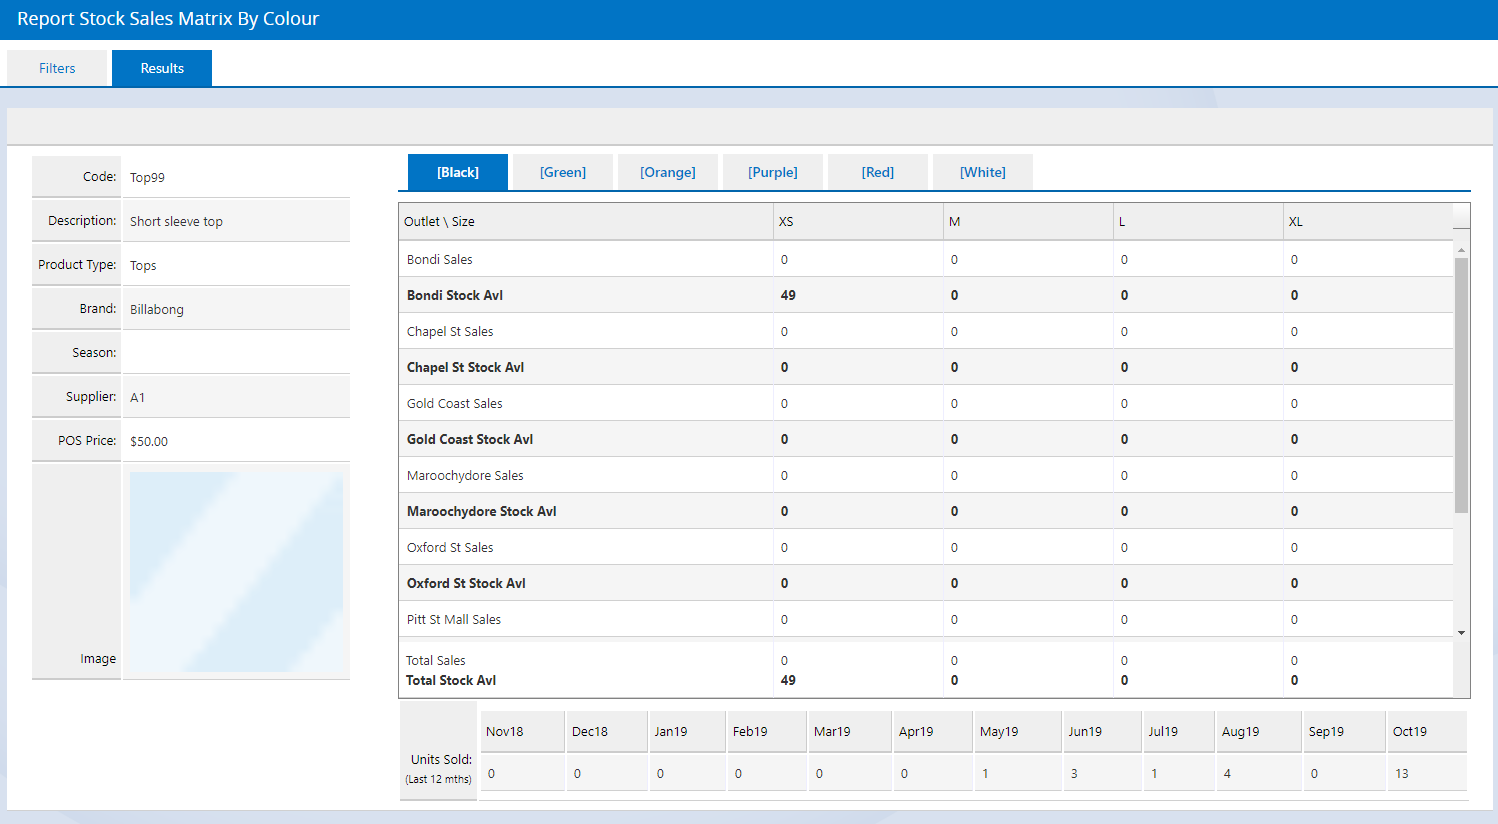
Stock Sales Matrix By Colour Report
The Stock Sales Matrix by Colour Report is displayed in a grid, and great for easily identifying the best performing attributes for a particular style e.g. the most popular colour, or size. Using this report, you can easily identify what quantities sold for a given style and colour at each outlet as well as the total Sales data for each month.
📋 Note:Products must be grouped together using the Manufacturer SKU i.e. all have the same style code in the Manufacturer SKU field.
This report is commonly used for apparel, but can also be used to report on any product that is the same style but comes in different colours or sizes (as long as that share the same Manufacturer SKU).
Access the report via Reports > Product Performance > Stock Sales Matrix By Colour. For more information refer to the Stock Sales Matrix By Colour article.
Back to top
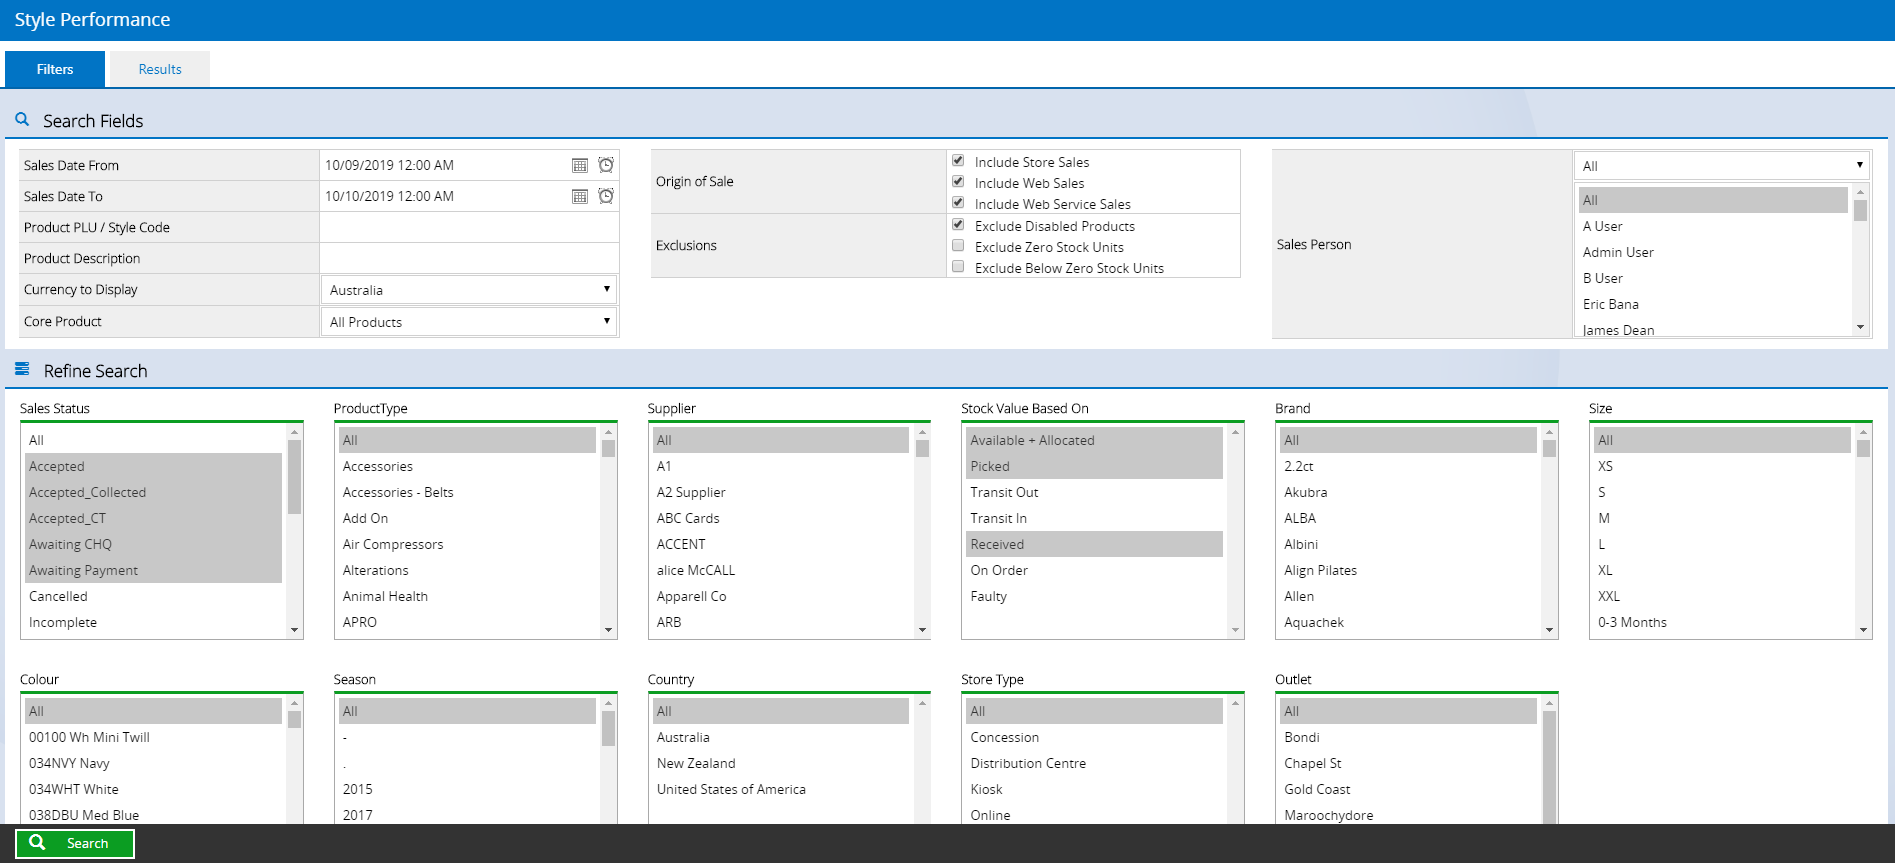
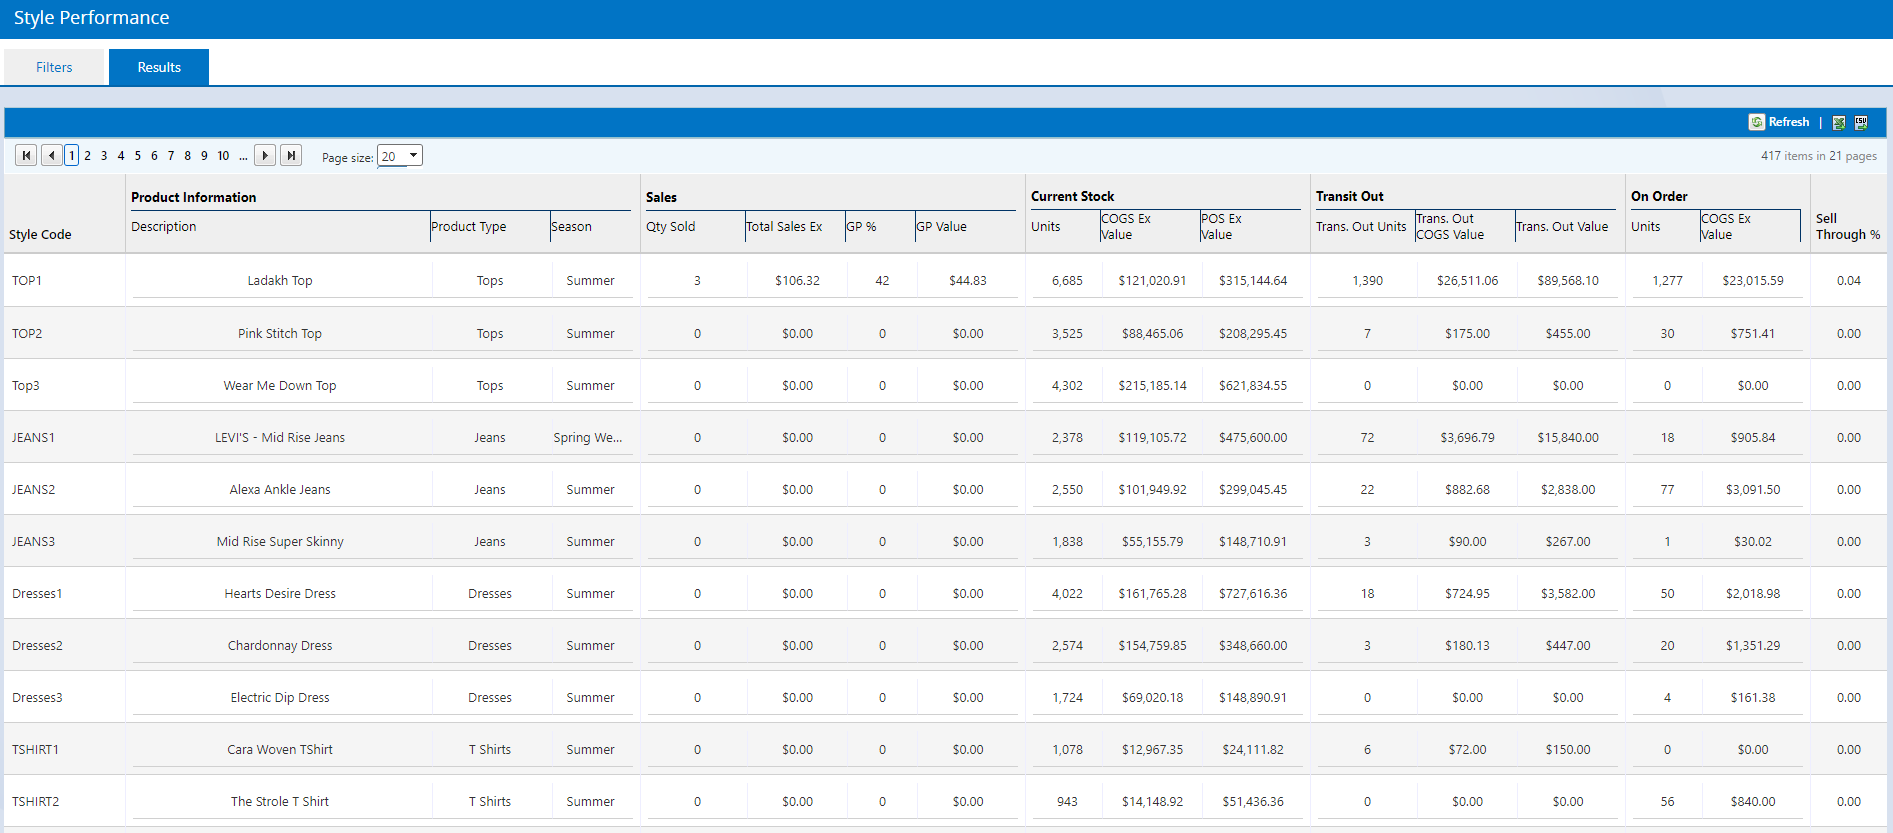
Style Performance Report
The Style Performance report (below) is great for simply reporting on a given style code as a whole (instead of the individual products in different colour and size variations) including your Current Stock levels and the Sell Through % rate. Current Stock can be controlled by various inventory status options i.e. you can choose to include or exclude Picked Stock, Faulty Stock and more.
📋 Note: Products must be grouped together using the Manufacturer SKU i.e. all have the same style code in the Manufacturer SKU field.
The report can be accessed via Reports > Product Performance > Style Performance Report. For detailed information refer to the Style Performance Report article.
Back to top
Related articles:
Related Articles
Product Catalog:
Inventory Management: