You can measure how quickly products sell through inventory by accessing sales rate reporting, which calculates sell-through velocity and inventory turnover for products. This metric helps retail operators identify fast-moving versus slow-moving items, optimize inventory replenishment cycles, and make informed decisions about stock levels based on actual sales velocity rather than just unit quantities.
Understanding product sales rates helps retail operators maintain optimal inventory turnover, reduce slow-moving stock accumulation, and ensure working capital is invested in products with proven sales velocity and customer demand.
There are several reports available that allow you to report on your Products and their associated Sales or sell-through rate.
Retail Express even offers data on some reports of products that aren't selling, so you can make an informed business decision. For example, you may want to review the inventory you keep in-store (and whether some lines should be discontinued), or you need to adjust any marketing/advertising or promotions for your products to encourage more sales.
Product Sales Report
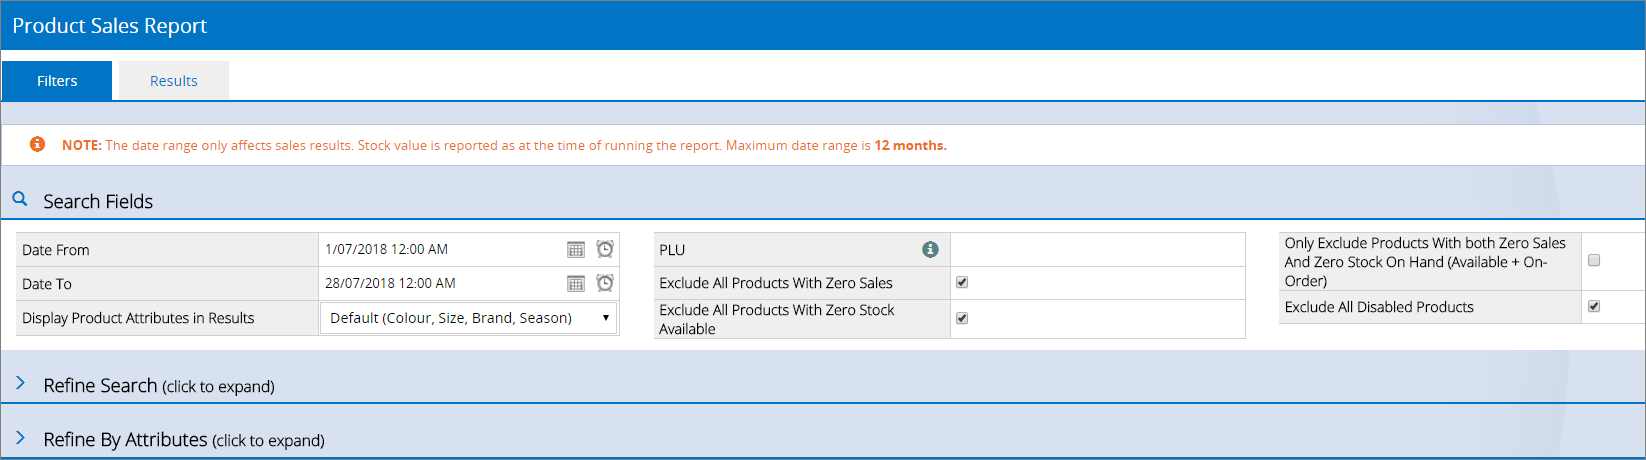
To access the Product Sales Report navigate to Reports > Product Performance > Product Sales Report.
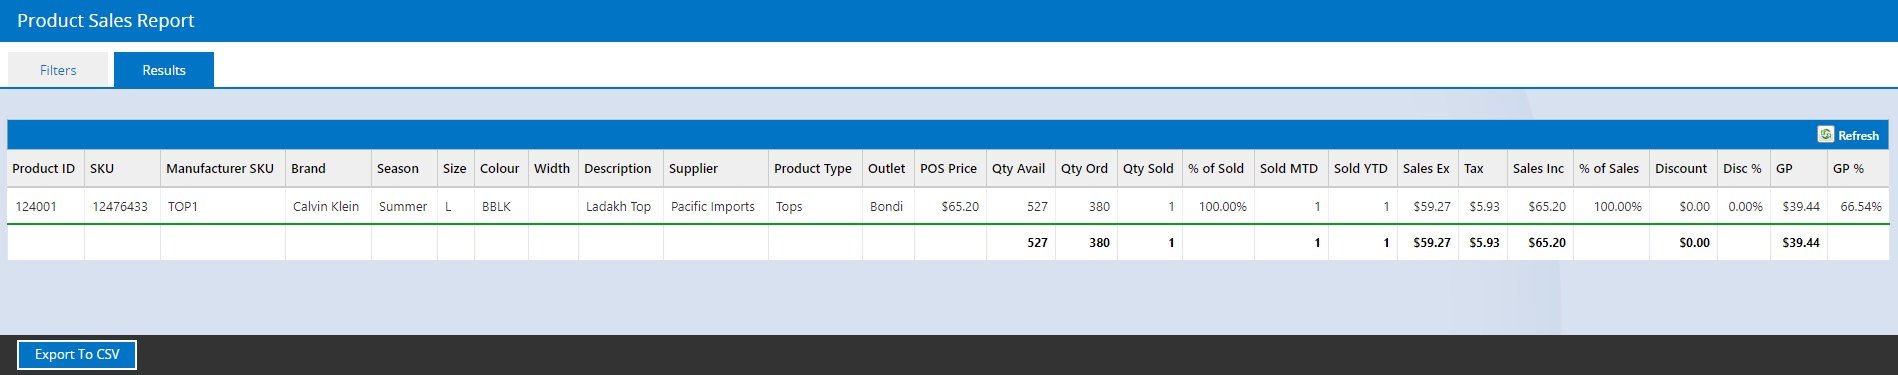
The Product Sales Report contains filters for excluding products with zero sales and/or stock, with the results showing:
- Stock levels
- Stock Value (current value)
- Sales (over a date range of your choice)
- Quantity ordered (over the same date range)
The date range only affects sales results; the Stock Value is reported at the time of running the report. The maximum date range is 12 months.
For detailed information on using this report refer to the Reports - Product Sales Report article.
Stock Value vs Sales
To access the Stock Value vs Sales report navigate to Reports > Stock Reports > Stock Value Vs Sales.
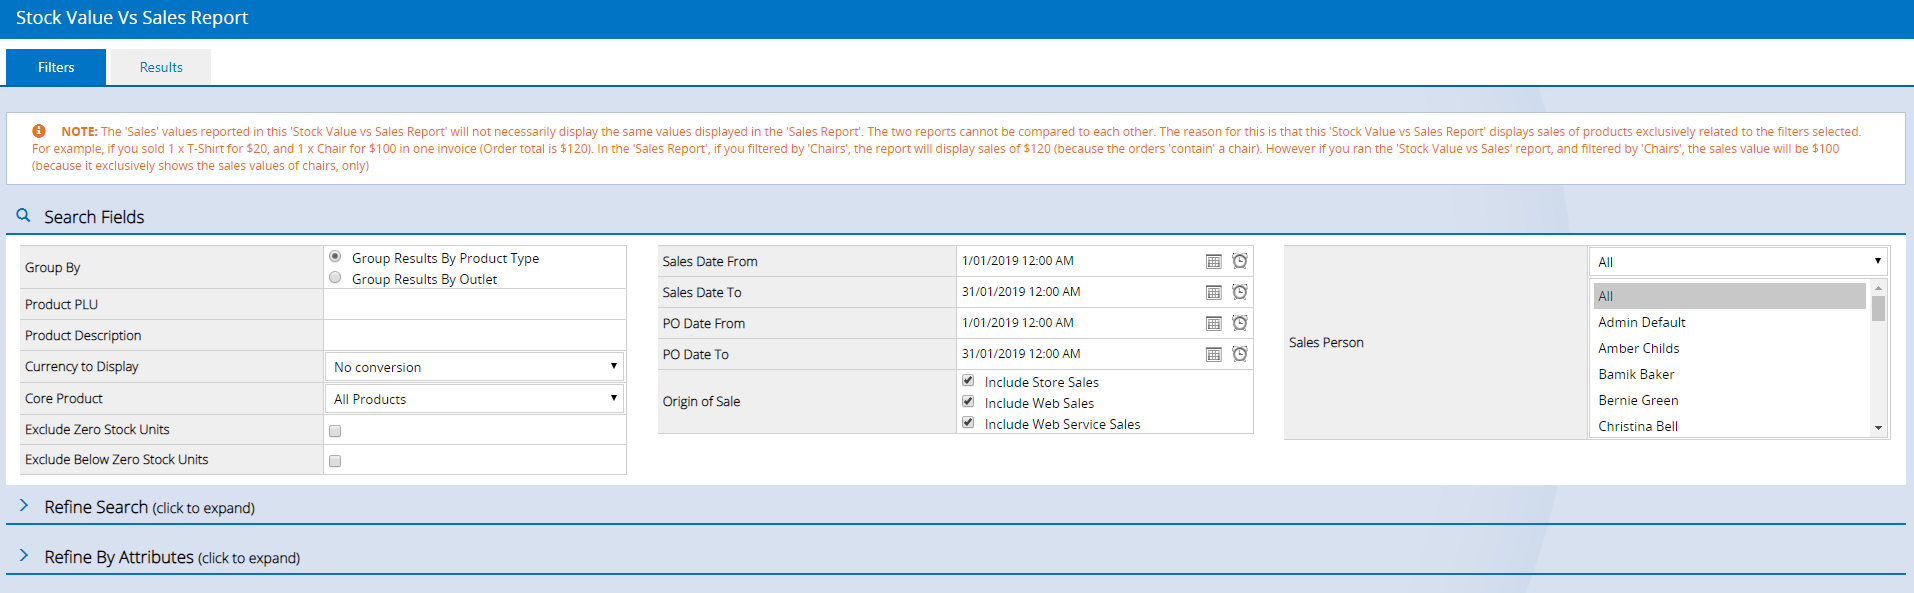
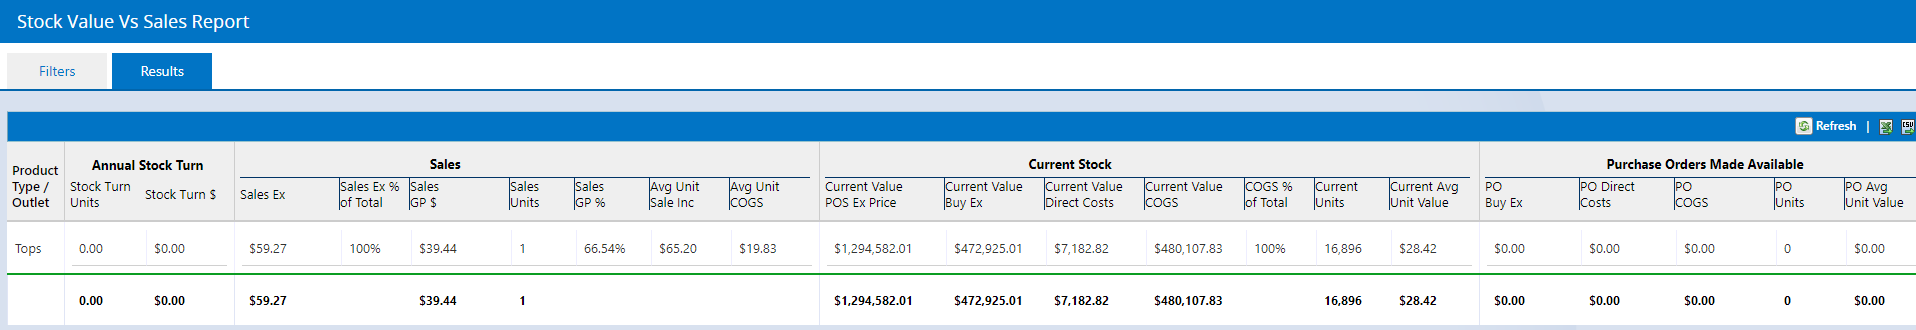
This report is quite extensive with the results broken into three sections:
- Sales
- Current stock value
- Purchase Orders
Tips for using this report:
Exclude below zero stock units | This important filter can drastically affect your inventory valuation. Products in your Inventory that have a negative quantity will detract from your inventory valuation unless this tickbox is selected. Ticking the box ensures that negative quantity Products are removed from this report. This is a useful filter if you have miscellaneous non-inventory type Products (eg: Labour, Service fee etc.) that are often sold into the negative quantity. |
Group By | This filter determines the grouping/layout of the report by Outlet or by Product Type. Use this filter if you want to see ALL Outlet valuations consecutively on the report instead of a total combined valuation. |
Don't compare the report to the Sales Report | The filtering of Sales on this report is different to the Sales Report. The Stock Value vs Sales only exclusively displays the sales value of the products matching the filters, whereas the Sales Report shows the value of the total order where there is a matching product on the sale. For example, if you sold 1 x T-Shirt for $20, and 1 x Chair for $100 on a single invoice, the Order total equals $120. - In the Sales Report, an applied filter of 'Chairs' will display a sales value of $120 - because the total order contains a chair.
- In the Stock Value vs Sales Report, an applied filter of 'Chairs' will display a sales value of $100 - because it exclusively shows the sales values of chairs, and NOT other products included on the same invoice.
|
For detailed information on the Stock vs Sales Report refer to the Reports - Stock Value vs Sales Report article.
Product Search & Management
To access the Product Search & Management feature use one of the following navigation paths:
- Inventory > Product Search & Management
- Quick Links > Product Search & Management
- Reports > Stock Reports > Product Search & Management
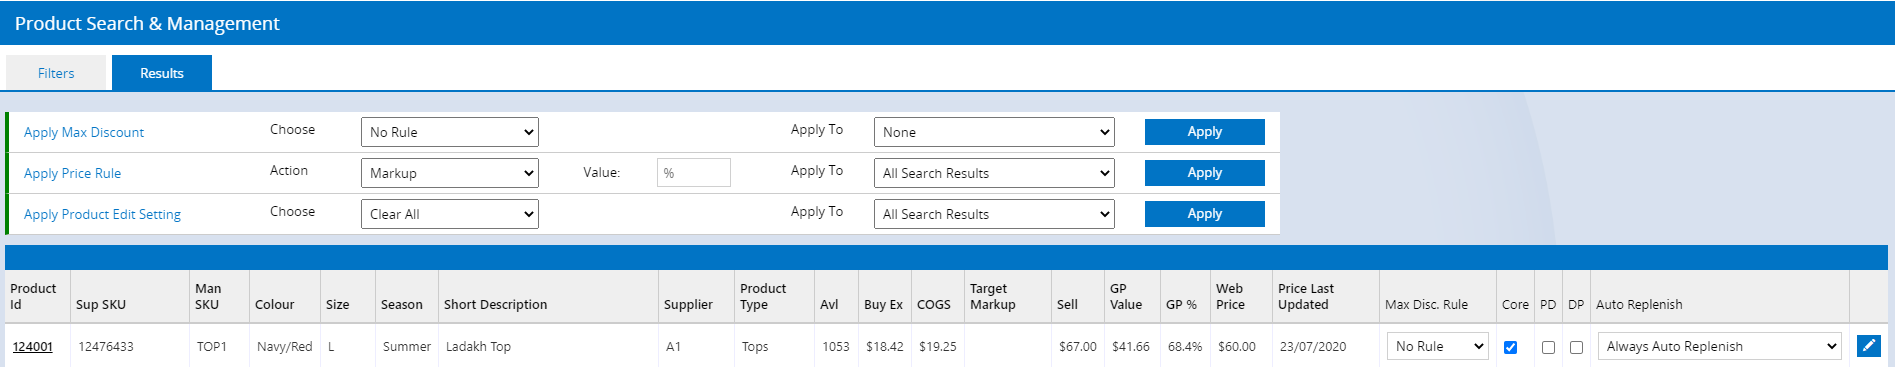
The Product Search & Management feature can be used to assist you in reviewing your slow-moving stock. Typically this feature is used for searching for products for maintenance purposes, but it can be incredibly helpful with product movements.
Advance Tip: Using the Product Search & Management feature you can find slow-moving stock, download the results into Excel and use that data to update the Product Mass Download spreadsheet to apply bulk promotional pricing to assist with encouraging sales.
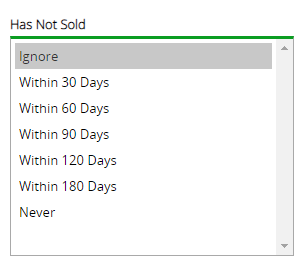
Click the option Refine Search to view a list of Filters. The filter "Has Not Sold (Slow)" allows you to target products that have not sold within a specific time frame.
For more information on this feature refer to the Inventory - Using Product Search & Management article.