You can monitor your inventory investment in Retail Express by accessing current stock valuation reports, helping your retail management understand the financial value tied up in inventory. This capability provides real-time visibility into total inventory worth across all locations and products, which helps support financial planning, insurance requirements, and business performance analysis.
Setting up regular stock valuation reviews enables your retail operations to make informed purchasing and pricing decisions, helping optimize inventory investment and working capital management. This helps retail businesses maintain appropriate stock levels while understanding the financial implications of inventory holdings across all store locations.
Retail Express reports are up-to-date at the time they're run, meaning that when you run your stock reports the Inventory Valuation is current to that minute.
The best report to use to find your current stock value is the Stock Value vs Sales Report. This report can be customised using a range of filters, including whether to be grouped by Outlet (your stores, warehouses etc) or by Product Type. It also includes information on Orders and Sales, although this can be disregarded if not required at the time.
Looking for information on your Stock Value for a previous date? Refer to the How to find a historical Stock Valuation article.
Essential Filter Selections
When using the Stock Value vs Sales Report for the current stock value there are a few specific filters you will need to focus on:
For detailed information on how to use the Stock Value vs Sales Report refer to the Reports - Stock Value vs Sales Report article. This article explains how to best use the report with the intention of reporting on your current stock levels.

Filter/Option | Details |
1- Group By | Allows you to group your report results by either Outlet (store locations and warehouses) and Product Type. Recommendation: Outlet, although can be changed depending on your preference |
2- Exclude Below Zero Stock Units | Products in your inventory that have a negative quantity will detract from your inventory valuation - this filter option allows you to exclude those products from the report. While it's recommended to keep your inventory levels as accurate as possible at all times, it's understandable that this situation can occur e.g. for miscellaneous products, or if you have a new product available for sale that you haven't been able to update the stock levels for as yet. POS will let you sell the stock "into negatives" i.e. have an Available count of less than zero. |
3- Stock Value Based On | Allows you to specify the inventory valuation depending on the selected Inventory Status options. The default filters are the most common, which are: - Available + Allocated
- Picked
- Transit In
- Received
- On Return
Retail Express will report a different inventory valuation depending on the option provided. |
4- Outlet | Used to control which Outlets are included in the report results. For example, you may wish to report on all Outlets together. Even when reporting on multiple Outlets in a single report, you can still separate the Outlets in the results using the "Group By" Outlet option. |
If you need to report on your inventory value at a specific time (e.g. End of Financial Year) you should run the report at that point in time and export a copy to refer back to later. Calculating a value at a historical point in time is difficult and has a high potential for error.
Viewing the Stock Value vs Sales Report Results
The Stock Value vs Sales Report is broken up into the following sections:
- A list of Product Types or Outlets (depending on your "Group By" section)
- Annual Stock Turn
- Sales
- Current Stock
- Purchase Orders Made Available
For the purposes of reporting on the current Stock Value refer to the Product Type/Outlet column and the Current Stock sections.
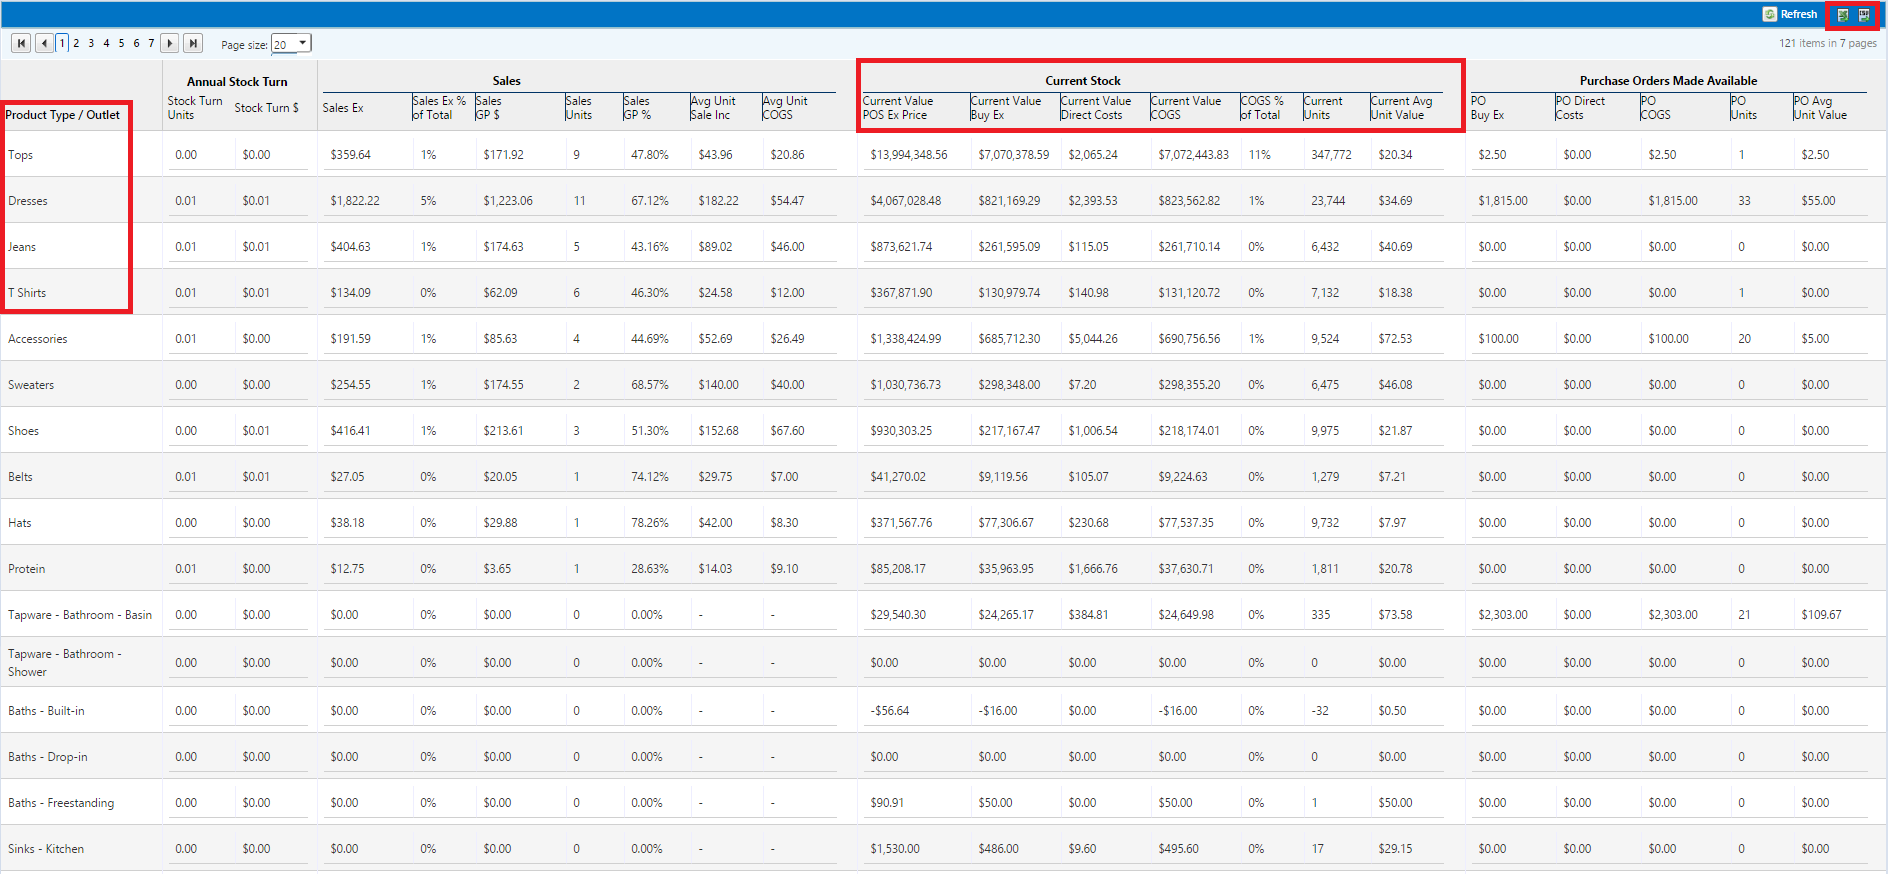
Current Stock columns
Column | Details |
Current Value POS Ex Price | Current stock value calculated from Your POS sell price |
Current Value Buy Ex | Current stock value calculated from your Buy Price excluding GST |
Current Value Direct Costs | Current value of direct costs |
Current Value COGS | Current stock value calculated from Buy Price Ex + Direct Costs This is the most commonly used Current Stock Value figure |
COGS % of Total | % value of COGS compared with other product types/outlets |
Current units | Current Units for each product type/outlet |
Current AVG Unit Value | Average unit value for each product type/outlet |
Exporting the Stock Value vs Sales Report
Once this Inventory Valuation has been run, it can be exported to save for future reference.
- Click on the Results tab
- Click the Excel or CSV icons (depending on your format preference)

- The file will download automatically
Retail Express operates from live inventory valuation which is obtained as of the second the report is run. Obtaining a historical inventory valuation can only be done by following the method outlined in the How to run a Historical Stock Valuation Report article.
Recommendation: Export the Report Frequently
It is highly recommended that the Stock Value Vs Sales report is run on a regular basis and exported for storage.
Later, if you need to refer to the inventory at a specific time you will be able to refer back to the stored files.
Frequently Asked Questions
The majority of reports in Retail Express are live at the time of running them. To find the stock value on a historical date, you will need to run various reports and manually calculate the total.
For more information on this process refer to the How do I run a Historical Stock Valuation Report? article.
The specific column you use to determine your current Stock Value is dependent on your business requirements. The Current Value COGS value is the most common value used, although you can also use the Current Value POS Ex Price or Current Value Buy Ex.
Refer to the column explanations in the Viewing the Stock Value vs Sales Report Results section to determine the value that best suits your business requirements.