You can configure the Low Stock Dashboard to identify the 25 products with the lowest days on hand based on run rate periods, helping prioritize reordering decisions to maintain inventory availability. This improves your retail operations efficiency by providing quick visibility into products needing replenishment, with properly configured low stock monitoring typically enabling better inventory management and reduced stockout situations that impact customer satisfaction.
Setting up low stock dashboards involves understanding days on hand calculations, run rate period selection, and multi-outlet comparison capabilities to help retail operators focus on the right inventory replenishment priorities, ensuring your retail strategy consistently drives better stock availability and customer service outcomes.
The Low Stock Dashboard Report shows you the 25 products with the lowest number of ?days on hand? based of the Run Rate period selected.
This report is often used to quickly see which products need to be ordered based of what has sold within a given period (if you needed to order some more to keep up with the demand in store).
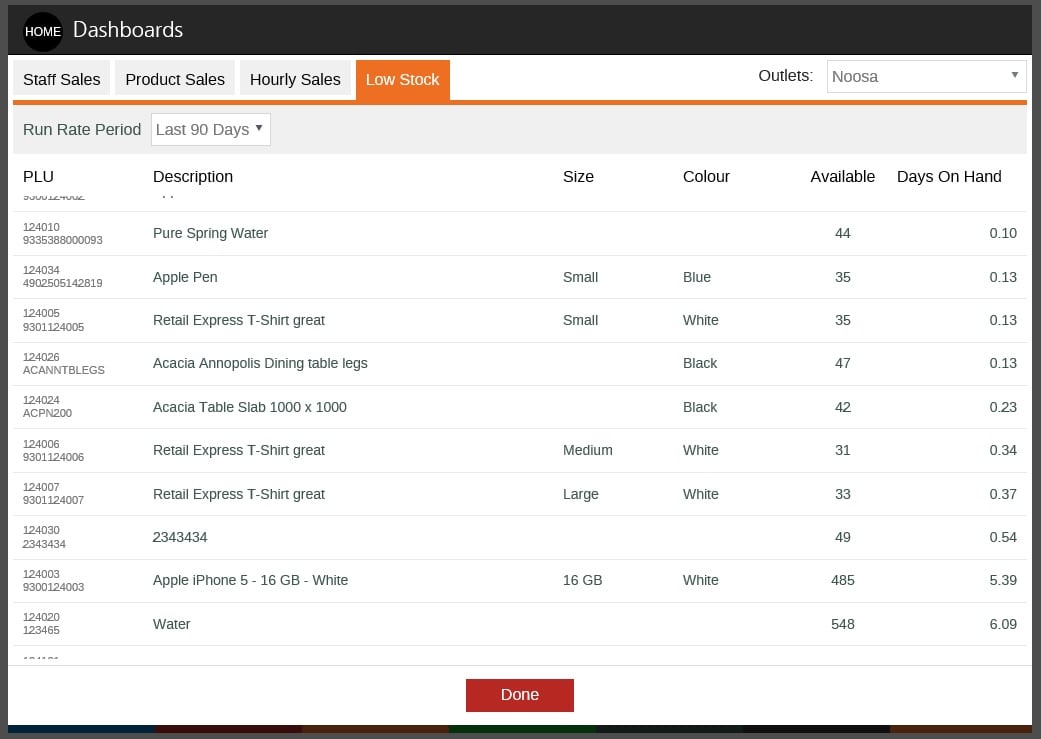
The Low Stock dashboard displays the 25 products with the fewest days' stock on hand at the selected outlet(s).
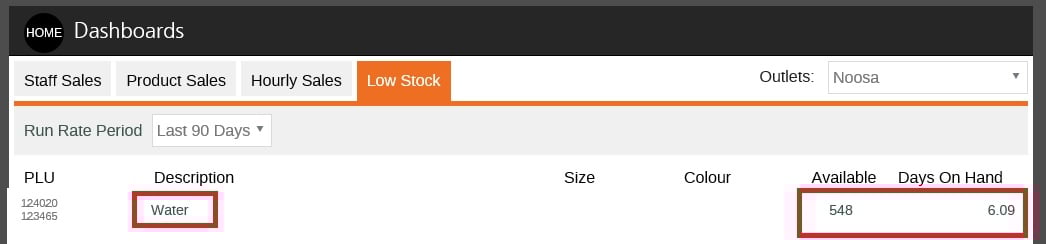
The Days On Hand value is calculated using the quantity of each product sold during the selected Run Rate Period (Days On Hand = Available / Average daily sales quantity during Run Rate Period selected)
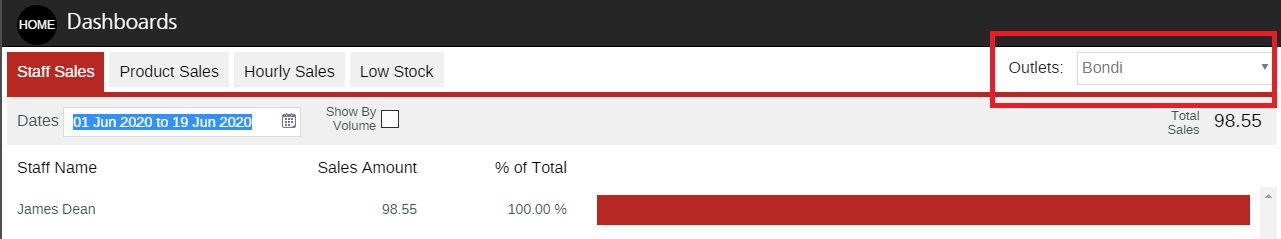
Selecting Multiple Outlets
By default this report will only show you the sales for the outlet that your currently logged into the POS with. You can select more outlets to view by clicking on the drop down menu in the top right hand corner:
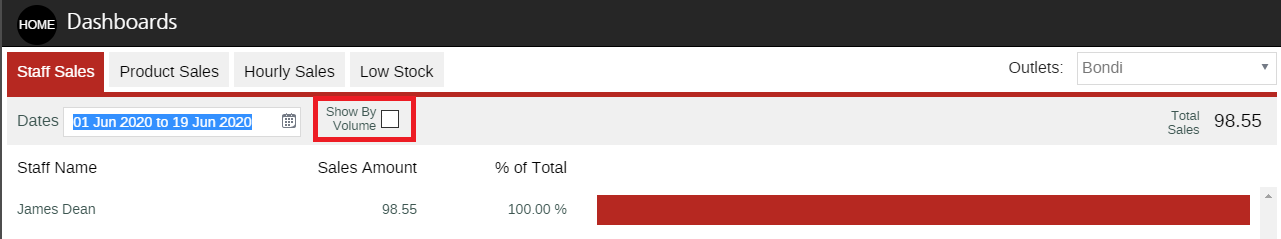
You also have the ability to choose whether to show the Sales by Sales $ Amount or by Sales Qty Sold amount by selecting the "Show by Volume" check box next to the Date Range: