You can track all financial transactions and value changes throughout your retail operations by accessing the Financial Movement Log, which provides a comprehensive audit trail of financial activity including sales, refunds, payments, and adjustments. This detailed transaction history helps support financial reconciliation, audit requirements, and discrepancy investigation by showing complete financial movement records across your retail operations.
Using the Financial Movement Log helps retail operators investigate financial anomalies, support audit processes, and maintain comprehensive financial transaction records that demonstrate proper financial controls and accountability.
The Financial Movement Log is a comprehensive report designed to track and analyze financial changes, product cost fluctuations with detailed information on outlet, product, and transaction data.
This dynamic report is designed to provide you with a deeper understanding of your inventory movements, giving you the insights you need to make informed decisions.
Key Features:
The Financial Movement Log is your go-to tool for tracking the before and after cost details for various movement types and cost changes within your inventory. Here's what it offers:
Comprehensive Cost Tracking: Gain a comprehensive view of product cost fluctuations with detailed information on outlet, product, and transaction data.
Extended Inventory Insights: Track inventory quantity changes with ease, including before-and-after values and deltas. The "Display Extended Inventory Buckets" filter expands your results grid for convenient exploration.
User Attribution: Identify the users associated with each transaction, helping you understand the driving forces behind financial changes.
How to Access the Report:
Getting Started:
You can access the
Financial Movement Log
by navigating to
Reports > Financial Reports > Financial Movement Log
in the Back Office.
Before accessing the Report, make sure the user has access to the 'Financial Movement Log' Report. You can Enable Product Details Log Report Staff >> Profile Security

On the filter page, Set your desired date range (defaults to the current date) and define any other fields you require. The "Results to Display" Filter can be used to show or hide results based on whether they have both a Qty and Cost change.
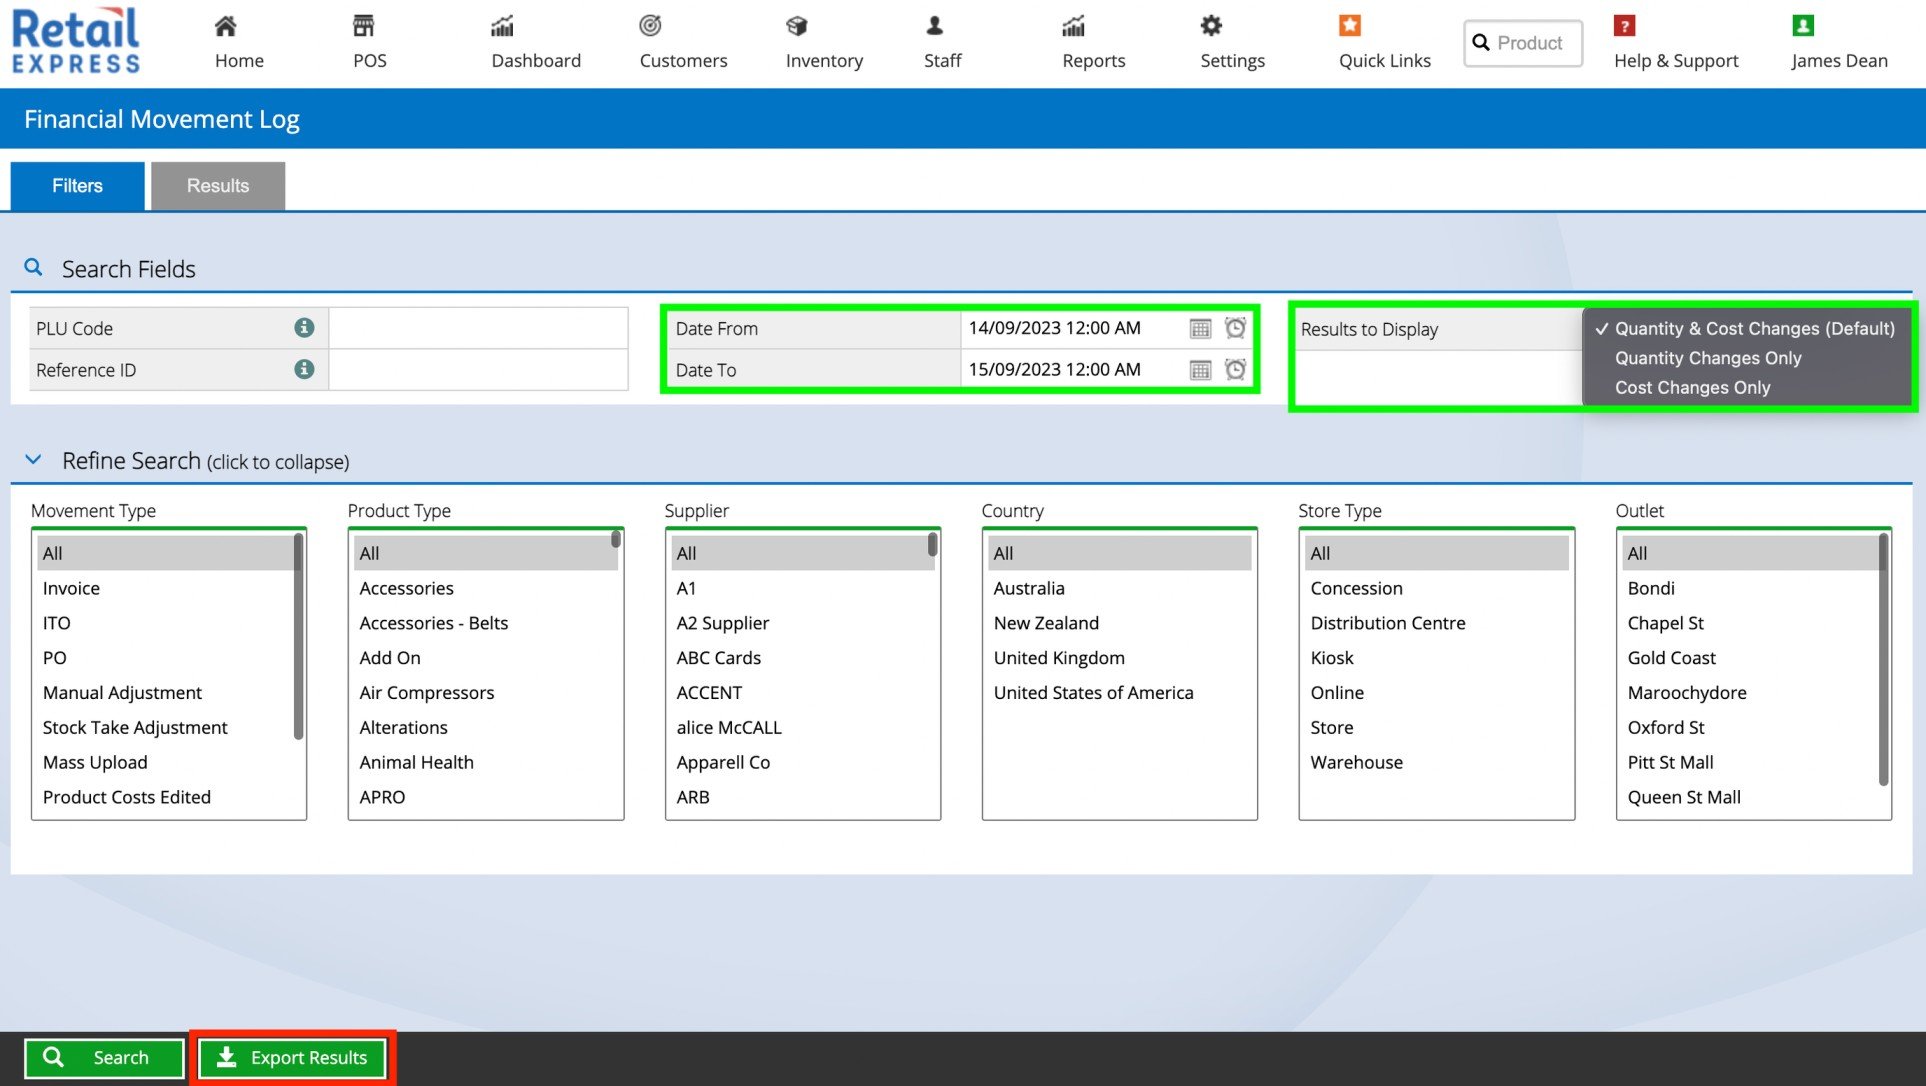
The furthest back the "As At" date can be set is the 1st of April 2023.
Understanding the Report:
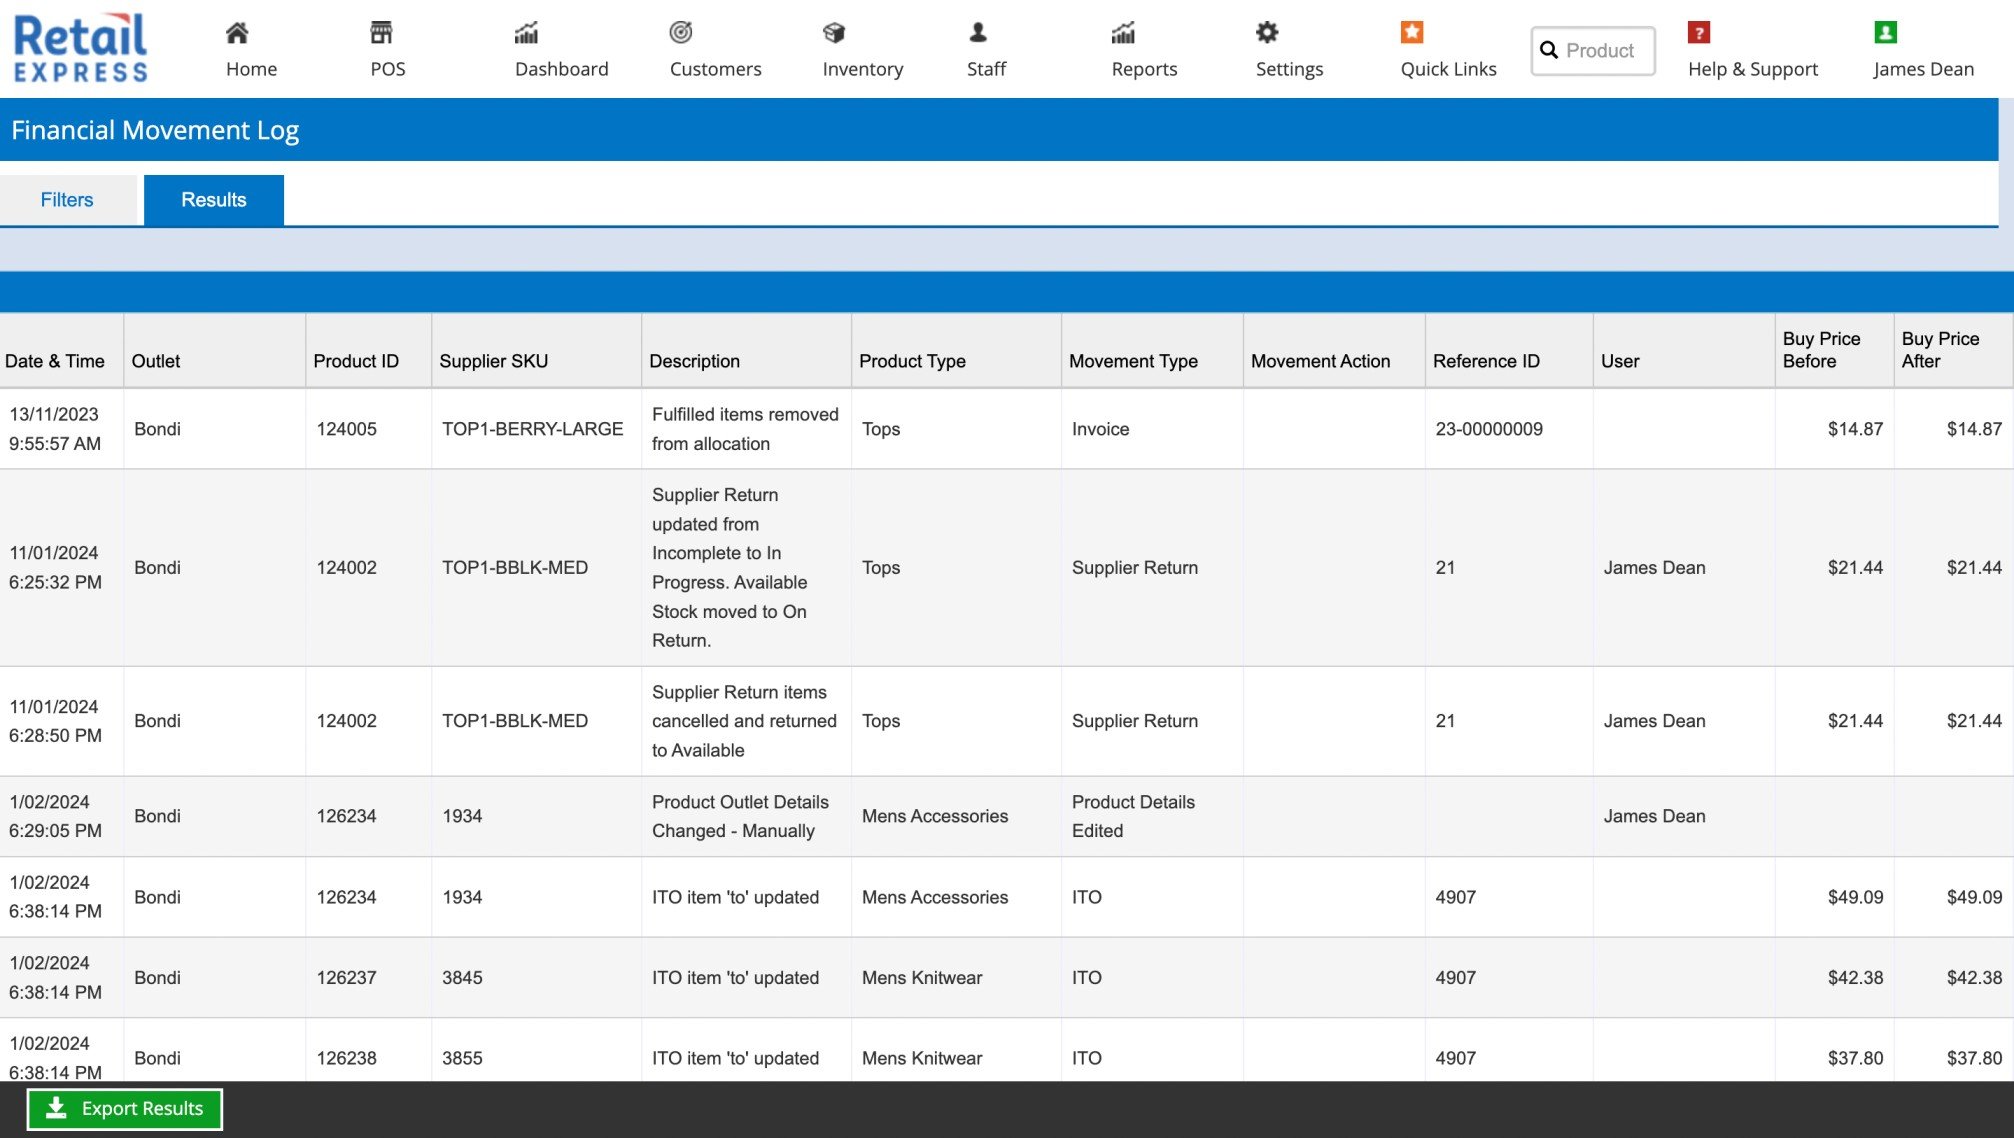
Viewing Report Results
The results depict the below fields:
- Date/Time of the movement.
- Outlet at which the movement occurred against.
- Product ID, SKU, Description & Product Type.
- Movement Type
- What the movement was caused by or related to:
- PO (Purchase Order)
- Product Details Edited
- Product Costs Edited
- Product Details & Costs Edited
- Invoice
- ITO
- Manual Adjustment
- & More...
- Movement Action
- How the action was performed (Not Applicable for All Movement Types)
- Shows values such as UI, API, Legacy Mass Upload
- Reference ID
- The Invoice, PO or ITO, or Stock Adjustment Number related to the movement.
- The user Who performed the action
- Cost Information
- Buy Price Before & After
- Direct Costs Before & After
- Change in COGS
- Represents the increase or decrease in COGS (Being the SUM(Buy Price + Direct Costs)
- Quantity Information
- Qty Before
- Qty Change
- Qty After
- Qty is calculated as the SUM of the below stock buckets:
- Available, Allocated, Picked, Transit In, Received, Faulty & On Return.
- These stock buckets are typically considered "your stock" including items in transit on a stock transfer to your outlet.
- Total COGS Before
- Qty Before * (Buy Price Before + Direct Costs Before)
- Total COGS Change
- Qty Change* (Change in COGS)
- This value represents the gain or loss in inventory value that occurred because of the specific log movement.
- This value can be used to manually journal inventory valuation changes that were incurred because of a manual price change for products that have some stock on hand, which is not otherwise passed through to accounting via the integrations.
- Total COGS AFter
- Qty After * (Buy Price After + Direct Costs After)
You can export the results using the Export Results button via
Export Download Manager
.
Inventory Qty in this report is calculated using the SUM(Available, Allocated, Picked, Transit In, Received, Faulty, On Return) stock statuses.
You may select a different stock bucket inclusion list using the "Inventory Qty Includes" filter however the default values are what is typically considered "your stock" including items in transit on a stock transfer to your outlet.