You can access comprehensive sales analysis and performance data by utilizing the Sales Report, which provides detailed transaction information, revenue metrics, and profitability insights across your retail operations. This versatile reporting tool helps retail operators understand business performance, identify trends, and make strategic decisions based on actual sales results and customer purchasing patterns.
Using the Sales Report effectively helps retail operators monitor performance against targets, identify growth opportunities, and optimize retail operations through data-driven insights into sales trends and customer behavior.
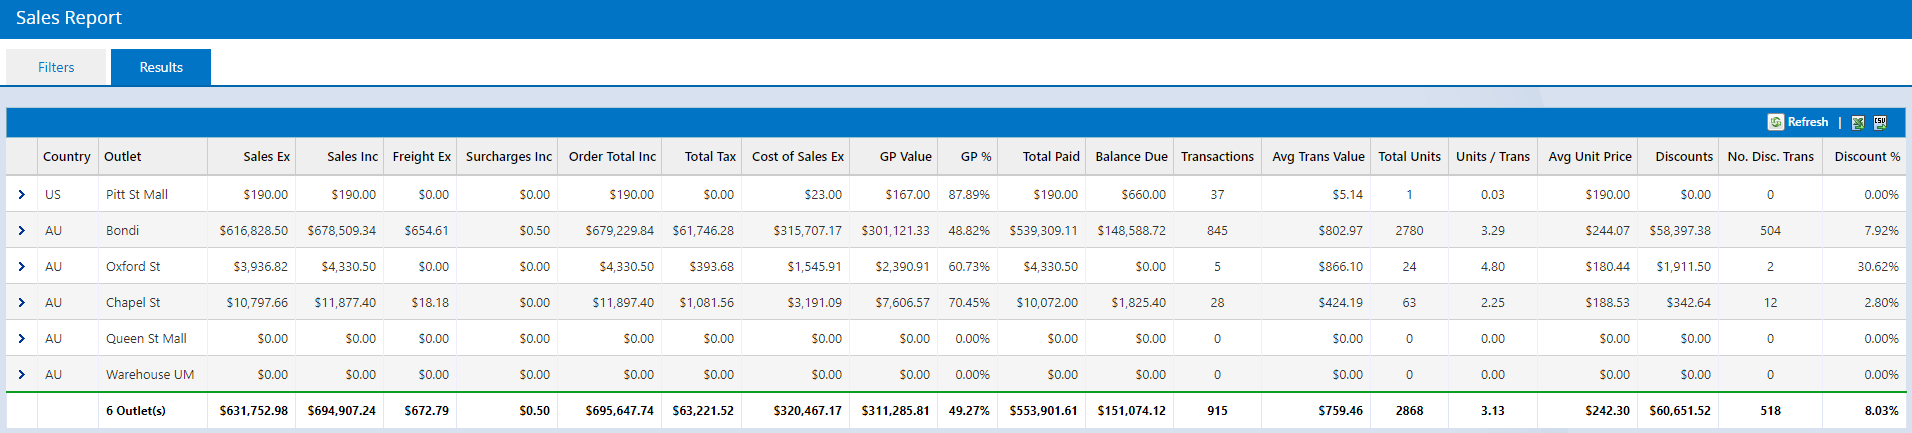
The Sales Report provides detailed information about individual transactions. Use the Sales Report as a supplement to the Stock Value Vs Sales Report when more detail is required, or in conjunction with the Income Report when investigating cash discrepancies.
This report should not be used as a single reference for overall sales information but in conjunction with the Stock Value vs Sales Report.
There are a number of ways to access the sales report:
- Quick Links > Sales Report
- Reports > Sales Reports > Sale Report
- Customers > Sales Report
The Sales Report (Limited) report is similar to the sales report but excludes Cost and GP information - ideal for when staff are not authorised to view the cost information.
Using the Sales Report
To use the Sales Report:
- Navigate to the report using one of the menu paths above
- Use the Filters as required (see below for detailed information)
- Click Search
- The results will be displayed
- To avoid grouping by Outlet tick the option Do not summarise by Outlet filter
- To Export the file click either of the icons in the top right-hand corner (XML or CSV available); the file will download immediately
If you require assistance or training in using Excel, free help is available directly from Microsoft
Filters

Most of the filters are self-explanatory, however, see the detailed information below for more advanced filtering explanations.
Filter | Details |
Order Number | The order number for the invoice. Entering an Order Number will ignore all other filter options and display this order only. |
Product PLU Code | Can be used to enter multiple codes when separated by a comma e.g. 1234, 1235, 1236. Valid codes for this field are: - Supplier SKU
- Manufacturer SKU
- Product ID
When filtering by a PLU the report will show the entire order including the matching PLU; not just the line item for that product only. For reports on specific products only refer to the Product Sales Report. |
Date From/Date To | The date range for the transactions on the report (used in conjunction with other filters). Clicking the date/clock icons will display a calendar/time picker. Match date and time with your Income Report |
Filter by Processed Date | Tick this box to report on sales that reached the Processed status within the date range. This will exclude any orders marked as Awaiting Payment. This filter should not be confused with the Sales Status filter. |
Do not summarise by Outlet | Ticking this option will display the orders in consecutive order instead of grouped by Outlet |
Performed Online/Offline | If a sale was processed while the system was Online or operating in Offline Mode |
Special Orders | Used to filter sales containing Special Order items (products sourced directly from the Supplier). |
Sales Status | Used to filter orders by a current status where the order was created within the date from/to range This filter should not be confused with the Filter by Processed Date filter |
Order Source | Where the sale originated from. All sales placed through the eCommerce API are from an order source of "WebService". The "Webstore" option is a legacy system. |