In an ever-increasingly competitive e-commerce landscape, businesses face the daunting challenge of understanding customers’ retail preferences and brand loyalty as well as creating effective marketing techniques to help improve customer retention and sales conversion.
To help you stay ahead, Marketing Cloud now provides an analytics-based eRFM report feature, designed to give you a complete, real-time view of how your customers engage with your brand.
By leveraging this feature, you can optimize your marketing strategies, increase customer retention, and ultimately boost your sales revenue.
In this module, you’ll find various tools and charts that make it easy to understand customer behavior at a glance:
- eRFM Heatmap Chart: Visualize customer engagement across multiple dimensions, i.e., recency, frequency, and monetary value, thus allowing you to quickly identify your most valuable customers and those who may need re-engagement.
- Customer Distribution Chart: This chart provides a clear breakdown of your customers into different segments based on their behavior, making it easy to target the right groups for specific campaigns.
- Customer Movement Chart: Track the flow of customers between different segments over time, helping you spot trends and act on shifts in customer behavior.
- Average Performance Chart: Compare the average performance of customer segments and adjust your strategies accordingly to maximize marketing effectiveness.
eRFM Heatmap Chart
This dashboard helps you understand your customers' brand affinity in relation to their engagement with your digital marketing efforts. Here you will see your customers divided into different groups based on their recency, frequency, and monetary habits, then further divided based on their engagement patterns. This information will provide you with deeper customer insights to facilitate more effective customer segmentation, personalized marketing, and retention strategies.
Prerequisites
To generate an accurate eRFM report, you need at least 180 days of transactional data from any source (e.g., APIs, Shopify, etc.) and 90 days of engagement data (e.g., abandoned carts, site visits, email clicks, and opens). If engagement data, such as site visits, abandoned carts, clicks, or opens, is missing or not enabled for an account, the system will skip these metrics when calculating the overall engagement score.
If a customer’s order information is unavailable, the eRFM report will display data that includes engagement level in terms of email clicks and opens. Such scenarios may impact the completeness of the RFM & engagement scores, but not the overall RFM report.
How to access the eRFM Report in Marketing Cloud
The charts and analytics section can be viewed by visiting the eRFM Report module from the Navigation panel.

Key Benefits of eRFM Reports
- Find and connect with your best customers: Connect with your best customers by targeting the right people at the right time using behavior and purchase data.
- Find new opportunities to increase sales: Identify prospective customers or those at risk of leaving and take action with targeted, real-time re-engagement campaigns.
- Make smarter marketing decisions in real-time: Use daily updates to stay agile, respond to customer behavior, and make smarter marketing decisions.
The RFM and Engagement Insights Chart
This table shows your customer groups based on their RFM score in the rows, their level of marketing interaction in the columns, and the number of customers and corresponding percentage change in the cells.

The customer count is updated daily at 1 AM EST (Eastern Standard Time). By default, the chart will display data for the last 90 days, but you can update the base and comparison dates using the drop-down to better suit your needs.

Each cell is color-coded to denote positive or negative trends with regards to their different engagement levels:
Color | Definition | Significance |
|---|
Green | Increase in Most Engaged, Highly Engaged, or Engaged segments. Decrease in Lightly Engaged or Not Engaged segments. | Indicates an increase in the number of customers who are more engaged with your brand and a decrease in those who are less engaged. |
Red | Decrease in Most Engaged, Highly Engaged, or Engaged segments. Increase in Lightly Engaged or Not Engaged segments. | Highlights important issues such as a decline in valued segments or an increase in customer retention risk. |
No Color (Neutral) | No change in count between the base date and comparison date, for all segments. | Indicates stability, allowing Maropost users to concentrate on sections that are neither expanding nor shrinking. |
By default, the chart displays data in the form of customer count. If you wish to see monetary-based analytics, you can switch to Revenue mode to view audience groups that contribute most to your business.
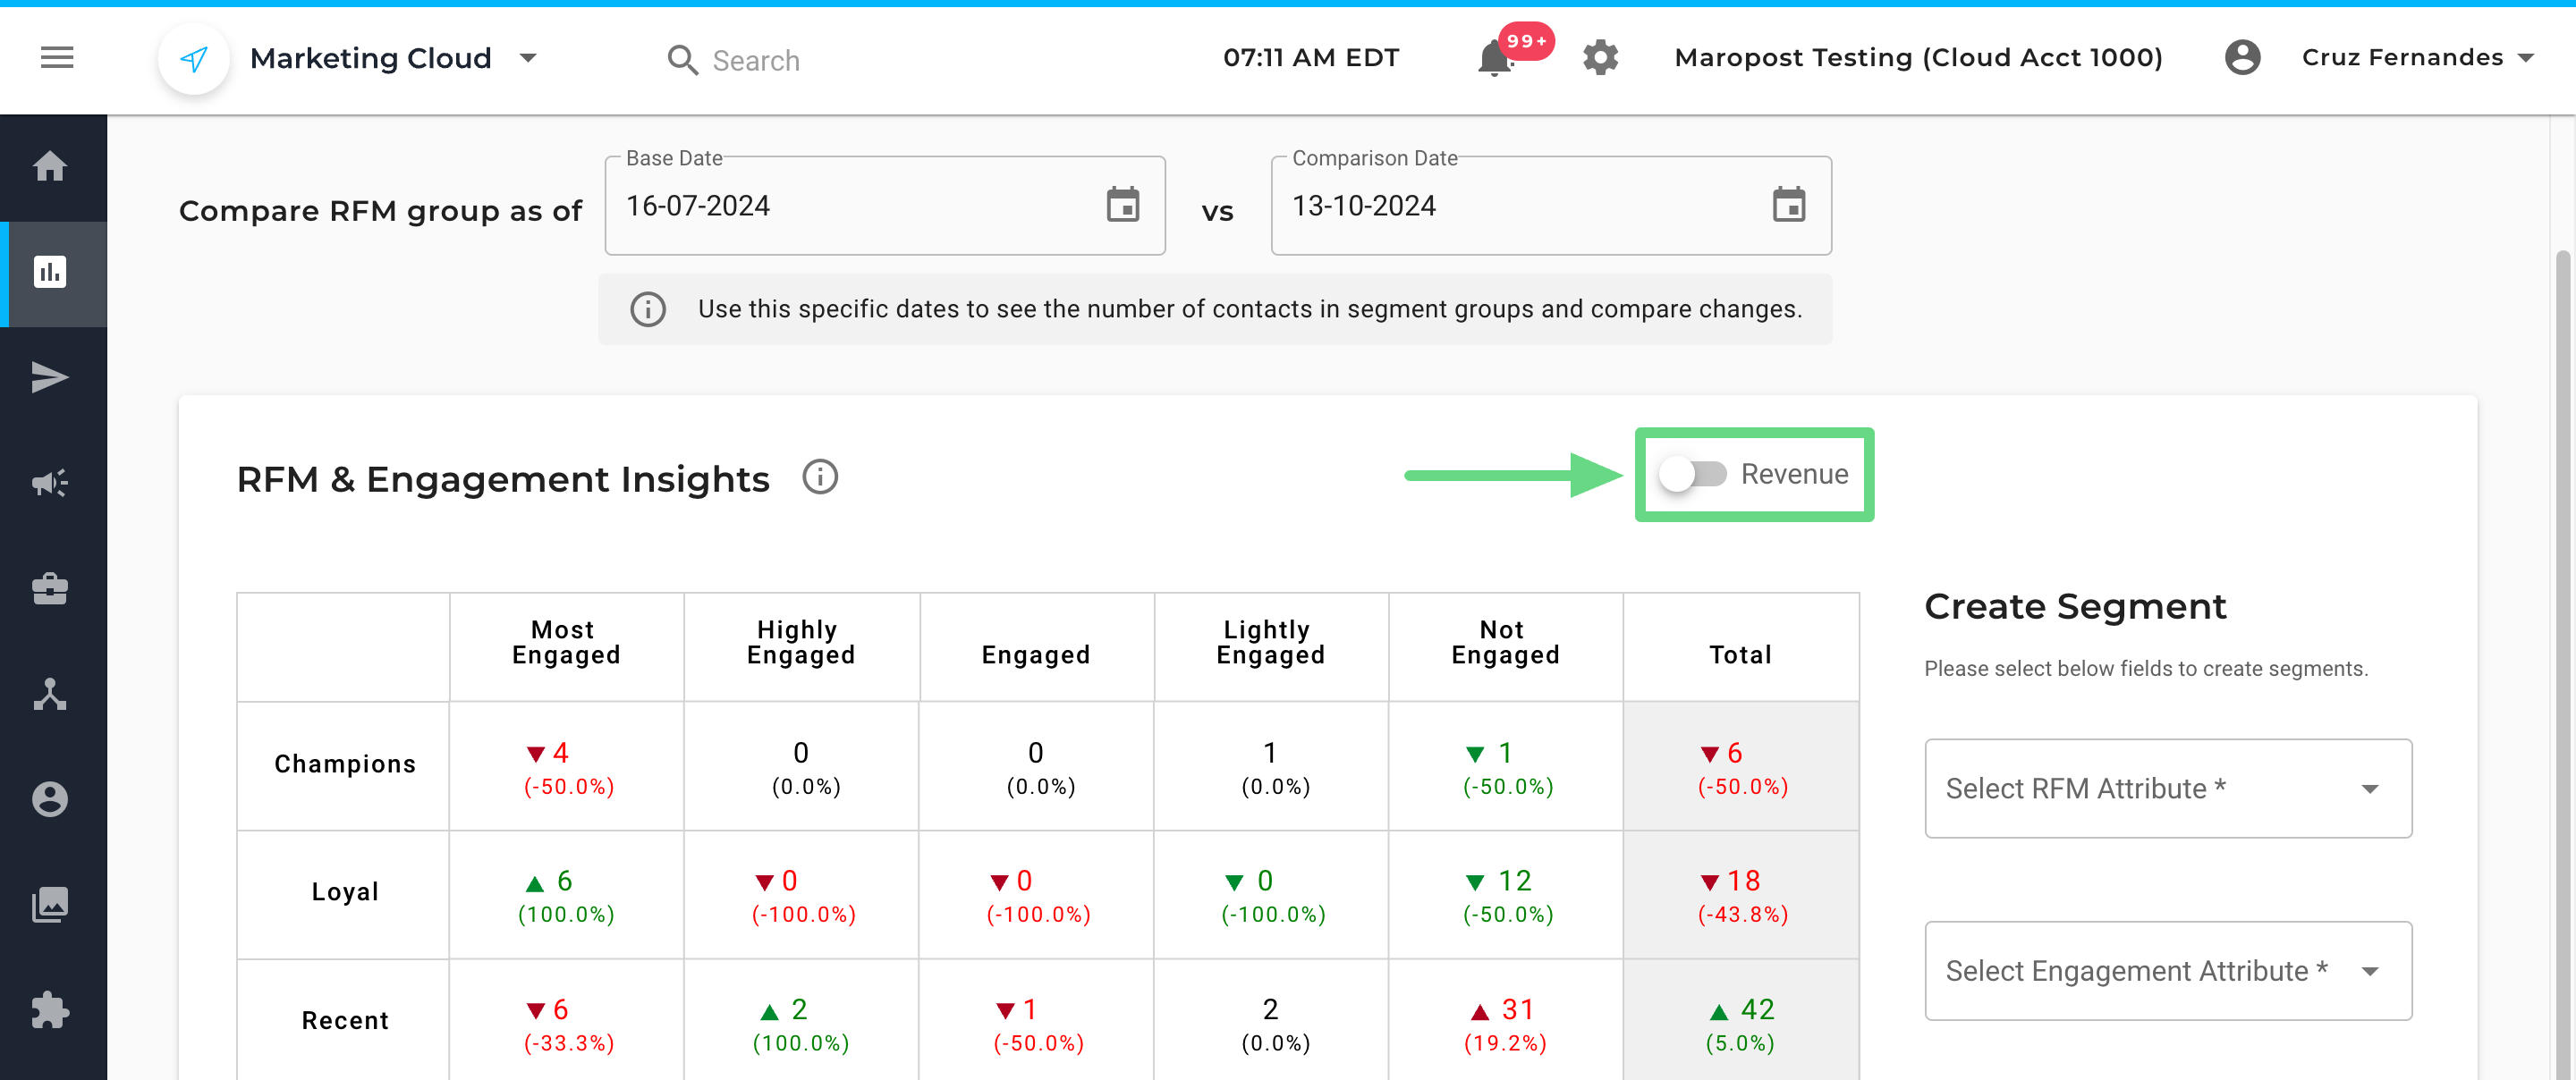
The purpose of this chart is to help you easily identify groups that require a form of interaction and quickly engage with them. To target any group, simply click on the appropriate cell or use the drop-downs under the Create Segment section and hit Create.

You’ll be redirected to the Next-Gen segment page, where segments of contacts can be created and added to your emails and journeys. To learn more about creating segments, read our Next Generation Segment Builder article.

Calculating RFM scores
An RFM score is calculated based on how recently customers made a purchase, how frequently they purchase overall, and how much they generally spend on individual transactions. RFM scoring methodology assigns a score of 0 (recency only), 1, 2, or 3 to each factor (Recency, Frequency, and Monetary), with 3 being the highest. The final score is a concatenation of all three factors. For example, if a customer’s recency score is “3”, frequency score is “2”, and monetary score is “1”, its RFM score would be “321”.
Important:
For enhanced accuracy, the eRFM report uses a recency-defined timeframe for all three metrics (Recency, Frequency, and Monetary). This means the frequency and monetary scores are calculated using the timeframe set for recency.
For example, if recency is set to 30 days, frequency and monetary calculations will also consider the last 30 days, rather than any other period.
Default Scores by Factor:
Factor | 0 | 1 | 2 | 3 |
|---|
Recency | The last purchase was more than 180 days ago | Last purchase 91 - 180 days ago | Last purchase 31-90 days | Last purchase within the last 30 days |
|---|
Frequency | N/A | < 2 purchases | 2-4 purchases | ≥ 5 purchases |
|---|
Monetary | N/A | < $200 spent | $200 - $499 spent | ≥ $500 spent |
|---|
RFM Score | Customer Groups |
|---|
323, 332, 333 | Champions |
213, 231, 232, 233, 321, 322, 331 | Loyal |
211, 212, 221, 222, 223, 311, 312, 313 | Recent |
111, 112, 113, 121, 122, 123, 131, 132, 133 | Need Attention |
011, 012, 013, 021, 022, 023, 031, 032, 033 | Inactive |
To summarize, an RFM score is calculated using these three factors:
- How recently a customer has transacted/engaged with a brand (merchant).
- How frequently a customer is involved with a brand.
- How much money a customer has spent on a brand’s products and services.
A higher RFM score means the customer is more valuable to the enterprise and should be prioritized when organizing or advertising your business brands.
To see a complete list of all scores alongside their cohorts, click here.
These group terminologies can be revised by clicking on the Groups tab.

The existing group names can be replaced by mentioning the new ones in the given field. Click Save to apply the changes made.

Important Note:
If the number of contacts shown in the insights chart differs from those in the resulting segments, some of these contacts may probably be on the DNM (Do Not Mail) list. Segments will exclude these contacts, while the insights chart displays all contacts.
We use industry averages to calculate recency, frequency, and monetary scores, but you can adjust these to better suit your business model in the Settings section.

Choose the recency definition and enter the number of days since the customer last purchased from your brand. The more recent the purchase, the higher the score a customer receives. This ranges from the lowest of “1” to the highest of “3”. To ensure a unified timeframe is selected across all three metrics and a consistent RFM score is precisely generated for different customer groups, the frequency and monetary calculations will automatically adjust to the recency period you’ve selected.
The customization options are defined below:
Recency Definitions:
- Description: Recency measures how recently a customer has purchased.
- How Ranks are allocated: You can adjust the number of days that determine a customer’s overall recency score.
- Ranking Specifications:
- Rank 3 (Most Recent): The number of days in which a purchase would be considered very recent.
- Rank 2 (Fairly Recent): The number of days in which a purchase would be considered fairly recent, but not most recent.
- Rank 1 (Moderate Recency): The number of days in which a purchase would be considered moderately recent.
- Rank 0 (Least Recent): The system automatically classifies all customers who fall outside the defined ranges for Rank 3, 2, and 1. Such customers haven’t purchased from your brand for quite a long time.

Note: You can define the recency timeframe for a maximum amount of 1000 days, corresponding to an approximate period of nearly three years.
Frequency Definitions:
- Description: Frequency measures how often a customer purchases from a business at a given time.
- How Ranks are allocated: The minimum number of purchases (without any threshold limit) is adjusted as per the recency timeframe that determines the overall frequency score of a customer.
- Ranking Specifications:
- Rank 3 (Most Frequent): The minimum number of purchases within a given recency timeframe that defines a high frequency.
- Rank 2 (Moderate / Average Frequency): The number of purchases considered to be of moderate quantity.
- Rank 1 (Least Frequent): Customers that don’t fulfill the criteria of Ranks 3 and 2 are automatically classified under Rank 1. They have purchased far less often compared to their counterparts.

Monetary Definitions:
- Description: Monetary scores are based on the total transactional value of all purchases made by a customer within a given timeframe.
- How Ranks are allocated: You can adjust the total dollar value of purchases (without any upper limit) made within the given recency timeframe, which determines a customer’s overall monetary score.
- Ranking Specifications:
- Rank 3 (Highest Spenders): The maximum dollar amount within a given recency timeframe that signifies high-spending customers.
- Rank 2 (Moderate / Average Spenders): A dollar amount that defines a moderate spend.
- Rank 1 (Low Spenders): Customers who spend an amount less than the dollar value mentioned in this field are designated as Rank 1. These customers spend the least amount compared to their counterparts.

After you have customized the definitions according to your needs, click on Apply to save the changes made.

Calculating Engagement Scores
Once customers are grouped, we look at their engagement with your brand in the last 90 days across website visits, email opens and clicks, and abandoned carts, and score them accordingly.
Scores are determined using a weighted point system based on the value of the engagement:
Engagement | Points |
|---|
Abandoned Cart | 4 points per abandoned cart within the given date range |
Site Visits | 3 points per site visit within the given date range |
Campaign Clicks | 2 points per click within the given date range |
Campaign Opens | 1 point per open within the given date range |
Scores are then tallied to determine the total Engagement Score, which then determines the Engagement Group:
Points | Total Engagement Score | Engagement Groups |
|---|
15+ points
|
5
|
Most Engaged
|
10-14 points
|
4
|
Highly Engaged
|
6-9 points
|
3
|
Engaged
|
2-5 points
|
2
|
Lightly Engaged
|
0-1 point
|
1
|
Not Engaged
|
Evaluating commercial opportunities based on customer groups
Every customer group presents an invaluable chance to promote your business/brand in a different aspect to a specified target audience in the hopes that they will climb up toward the positive trend of being more involved with your marketing viewpoints and help reduce the ongoing risk of churning out disinterested customers, which could hinder sales in the long term.
Champions
These are considered to be the highest-value customers in regard to recent purchase activity. They have a strong engagement history and are the first groups who’ll partake in your newsletters and referral programs whenever incentivized.
You can further bolster this relationship by initiating exclusive offers such as providing early access to your premium products or giving out merchandise to senior subscribers, thereby not only appreciating their time but also amplifying their loyalty with respect to your business/brands.
Loyal
These clients are thought to be fairly active in view of their recent and frequent shopping experience, plus they resonate well with your products/services. However, their overall historical sales and value towards your brands are less than compared of the “Champions” group.
Take steps to convert these loyal customers into your dedicated supporters through engaging content, upselling your best products, inviting them to special business events, endorsing secret sales, etc., in the hopes of making them feel special.
Recent
These clients have purchased or interacted with your business quite lately, but they don’t seem to be frequently active.
Focus on bringing them back into the marketing funnel by first understanding their taste and preferences. You can achieve this via surveys and product recommendations. Next, you can look at converting such groups into repeat buyers through upselling or cross-selling techniques. Also, put more emphasis on building trust with such groups through your blogs, videos, guides, etc., as it can foster more attention for future communications.
Need Attention
This group has shown a substantial drop-off in purchase history and likely needs attention to re-engage. Consider trying to re-engage this group through reactivation journeys, “we miss you” offers, and product refill reminders.
Inactive
This is your least valuable group, but could potentially convert when treated appropriately. Consider a re-engagement series asking them if they would still like to receive special offers, and opt them out if they do not answer. Many marketers will also gamify these series with spin-to-win deals. For the customers in this group with low engagement, consider removing them from your subscription lists to avoid deliverability concerns.
Table of scores
Recency | Frequency | Monetary | SCORE | Cohort |
|---|
3: Last purchase in the last 30 days | 2: 2-4 purchases | 3: $500+ spent | 323 | Champions |
3: Last purchase in the last 30 days | 3: 5+ purchases | 2: $200 - $499 spent | 332 | Champions |
3: Last purchase in the last 30 days | 3: 5+ purchases | 3: $500+ spent | 333 | Champions |
2: Last purchase 31-90 days ago | 1: less than 2 purchases (includes none) | 3: $500+ spent | 213 | Loyal |
2: Last purchase 31-90 days ago | 3: 5+ purchases | 1: under $200 spent (includes $0) | 231 | Loyal |
2: Last purchase 31-90 days ago | 3: 5+ purchases | 2: $200 - $499 spent | 232 | Loyal |
2: Last purchase 31-90 days ago | 3: 5+ purchases | 3: $500+ spent | 233 | Loyal |
3: Last purchase in the last 30 days | 2: 2-4 purchases | 1: under $200 spent (includes $0) | 321 | Loyal |
3: Last purchase in the last 30 days | 2: 2-4 purchases | 2: $200 - $499 spent | 322 | Loyal |
3: Last purchase in the last 30 days | 3: 5+ purchases | 1: under $200 spent (includes $0) | 331 | Loyal |
2: Last purchase 31-90 days ago | 1: less than 2 purchases (includes none) | 1: under $200 spent (includes $0) | 211 | Recent |
2: Last purchase 31-90 days ago | 1: less than 2 purchases (includes none) | 2: $200 - $499 spent | 212 | Recent |
2: Last purchase 31-90 days ago | 2: 2-4 purchases | 1: under $200 spent (includes $0) | 221 | Recent |
2: Last purchase 31-90 days ago | 2: 2-4 purchases | 2: $200 - $499 spend | 222 | Recent |
2: Last purchase 31-90 days ago | 2: 2-4 purchases | 3: $500+ spent | 223 | Recent |
3: Last purchase in the last 30 days | 1: less than 2 purchases (includes none) | 1: under $200 spent (includes $0) | 311 | Recent |
3: Last purchase in the last 30 days | 1: less than 2 purchases (includes none) | 2: $200 - $499 spent | 312 | Recent |
3: Last purchase in the last 30 days | 1: less than 2 purchases (includes none) | 3: $500+ spent | 313 | Recent |
1: Last purchase 91-180 days ago | 1: less than 2 purchases (includes none) | 1: under $200 spent (includes $0) | 111 | Needs attention |
1: Last purchase 91-180 days ago | 1: less than 2 purchases (includes none) | 2: $200 - $499 spent | 112 | Needs attention |
1: Last purchase 91-180 days ago | 1: less than 2 purchases (includes none) | 3: $500+ spent | 113 | Needs attention |
1: Last purchase 91-180 days ago | 2: 2-4 purchases | 1: under $200 spent (includes $0) | 121 | Needs attention |
1: Last purchase 91-180 days ago | 2: 2-4 purchases | 2: $200 - $499 spent | 122 | Needs attention |
1: Last purchase 91-180 days ago | 2: 2-4 purchases | 3: $500+ spent | 123 | Needs attention |
1: Last purchase 91-180 days ago | 3: 5+ purchases | 1: under $200 spent (includes $0) | 131 | Needs attention |
1: Last purchase 91-180 days ago | 3: 5+ purchases | 2: $200 - $499 spent | 132 | Needs attention |
1: Last purchase 91-180 days ago | 3: 5+ purchases | 3: $500+ spent | 133 | Needs attention |
0: Last purchase over 180 days ago | 1: less than 2 purchases (includes none) | 1: under $200 spent (includes $0) | 011 | Inactive |
0: Last purchase over 180 days ago | 1: less than 2 purchases (includes none) | 2: $200 - $499 spent | 012 | Inactive |
0: Last purchase over 180 days ago | 1: less than 2 purchases (includes none) | 3: $500+ spent | 013 | Inactive |
0: Last purchase over 180 days ago | 2: 2-4 purchases | 1: under $200 spent (includes $0) | 021 | Inactive |
0: Last purchase over 180 days ago | 2: 2-4 purchases | 2: $200 - $499 spent | 022 | Inactive |
0: Last purchase over 180 days ago | 2: 2-4 purchases | 3: $500+ spent | 023 | Inactive |
0: Last purchase over 180 days ago | 3: 5+ purchases | 1: under $200 spent (includes $0) | 031 | Inactive |
0: Last purchase over 180 days ago | 3: 5+ purchases | 2: $200 - $499 spent | 032 | Inactive |
0: Last purchase over 180 days ago | 3: 5+ purchases | 3: $500+ spent | 033 | Inactive |
Customer Distribution Chart
This section presents a visual and tabular representation of customer counts across different RFM groups within a specified period.
By default, the "contact chart distribution" type is shown in this region.
Contacts
This chart illustrates the contact distribution across different RFM groups, based on your chosen base date and comparison date. It helps you identify current trends and interaction levels in your business by viewing the size of your customer groups, and you can compare such changes at different intervals.

By identifying which customer groups are growing, shrinking, or staying consistent, you can make informed decisions on future marketing efforts.
Added or Dropped
This chart depicts the number of customers added or removed from a group during the specified period. It's displayed in a bar/column format with a dark bar denoting the number of customers added to a group and a lighter bar denoting the number of customers dropped from a group.

By understanding the overall customer movement between segment groups, you can get an insight into customer acquisition, retention, and churn, which can help you enhance your engagement strategies.
Percentage Change
This table shows the percentage change in the contact distribution across each segment group, thereby allowing you to assess how much a customer group has either grown or shrunk from the base date to the comparison date. It helps you to monitor the growth or decline of your customer segments and evaluate the effectiveness of your marketing campaigns.
The table displays the following column metrics:
- Group: Displays different customer engagement segments like "Champions," "Loyal," "Recent," "Needs Attention," and "Inactive."
- Base total: Shows the number of contacts in each segment at the start date.
- Base %: Displays the percentage of total contacts for each segment at the start date.
- Comparison total: Shows the number of contacts in each segment at the end date.
- Comparison %: Displays the percentage of total contacts for each segment at the end date.
- Percent change: Displays the percentage change in contact count for each segment between the start and end dates, calculated using the formula:
Percent change = ((Comparison total - Base total) / Base total) * 100

It gives you a complete breakdown of the number of customers present in each RFM group while highlighting the measures you must implement to boost engagement levels in segment groups (Champions, Loyal) that benefit your business.
Customer Movement Chart
This section displays how contacts (customers) move from one RFM group to the other over a period of time in the form of an infographic or a table.
Group Chart
This chart is depicted as a Sankey diagram that shows how contacts move between different RFM groups within a given timeframe. By having a glance at the flow, you can keep track of customer movement between groups and spot trends in customer loyalty, engagement, and attrition.

Since it is a graphical illustration, the flow is easily visualized as compared to a numerical table. To further highlight a particular flow, you can either hover or click on a pathway and get a glimpse of how many customers have moved from one RFM group to another during a specific time.
Table Mode
If you want to switch from a diagram schematic to a tabular format, switch to Table Mode by enabling the toggle. Here, you can view the exact date and number of customers transitioning between groups. Using this information, you can properly plan to draft campaigns that cater to customers who are at risk of being left out.

Average Performance Chart
It’s a detailed chart that displays average performance metrics (e.g., days since last purchase, total orders, total revenue) for different customer engagement segments. It provides a comprehensive understanding of key performance indicators for each segment, enabling informed decisions on improving customer engagement and retention strategies.
You can switch between the base date and comparison date sections and compare customer metrics such as site visits, click rates, and abandoned carts over a period.

Note: Data is calculated based on the last 90 days for engagement metrics, and the last 180 days for purchase-related metrics (e.g., days since last purchase, total orders).
FAQs
Q1) What is the Engagement (E) score, and how is it calculated?
The Engagement (E) score measures how actively a contact interacts with your brand, based on actions like site visits, abandoned carts, email opens, and clicks. Each type of engagement is assigned a specific weight. The final score is a sum of these weighted interactions, which is then converted into a 1-5 scale to categorize engagement levels.
Q2) How is the Recency (R) score calculated?
The Recency (R) score is based on the number of days since a customer’s last purchase. You can select the recency’s timeframe (e.g., 30, 60, or 90 days) accordingly. The more recent the purchase, the higher the recency score:
- Last purchase within 30 days = 3 points.
- Last purchase between 31-90 days = 2 points.
- Last purchase between 91-180 days = 1 point.
- Last purchase more than 180 days ago or no purchase = 0 points.
To accurately calculate the customer’s activity during a period, the timeframe selected for Recency will also apply to Frequency and Monetary calculations. Such calculations are adjusted dynamically, i.e., if you update the Recency timeframe, the Frequency and Monetary calculations will automatically change to match the new Recency timeframe.
Q3) What does the Frequency (F) score represent?
The Frequency (F) score reflects how often a customer purchases within the selected Recency timeframe (e.g., 30, 60, or 90 days). Customers with more frequent purchases receive higher scores:
- 5 or more purchases = 3 points.
- 2-4 purchases = 2 points.
- Less than 2 purchases = 1 point.
- No purchases = 0 points.
Q4) How is the Monetary (M) score determined?
The Monetary (M) score is based on the total amount the customer has spent within the selected Recency timeframe (e.g., 30, 60, or 90 days). Customers who spend more receive higher scores:
- Spent $500 or more = 3 points.
- Spent between $200 - $499 = 2 points.
- Spent less than $200 = 1 point.
- Haven’t spent any amount = 0 points.
Q5) What is the purpose of categorizing customers into groups based on eRFM scores?
The eRFM score allows you to segment your customers into groups like Champions, Loyal, Recent, Needs Attention, and Inactive. Each group represents different levels of customer value and engagement, helping you target specific strategies, such as loyalty rewards, re-engagement campaigns, or personalized promotions.
Q6) Why is the eRFM date range set to 90 days, and can it be changed?
The 90-day window offers a balanced view of recent customer behavior, capturing transactions and engagements without being too short or too long. This ensures you have a comprehensive understanding of customer interactions. Although 90 days is the standard range, users may be able to adjust the window based on specific business needs.
Q7) What is the difference between an Engagement score and an RFM score?
The Engagement score measures how actively customers interact with your brand (e.g., site visits, email clicks), while the RFM score focuses on purchasing behavior (Recency, Frequency, and Monetary). Some insights and charts combine both scores for a more comprehensive view of customer performance.
Q8) Why does the segment count not match the count of contacts in the segments?
If you notice a discrepancy between the number of contacts shown in the Insights chart and those in your created segments, it may be due to contacts being on the Do Not Market (DNM) list. Segments will exclude these contacts, while the Insights chart displays all contacts, including those who are not currently marketable.
Marketers often want to see a full view of their customer base, including contacts who are on the DNM list, to understand overall engagement and behavior regardless of mailing subscription status. This is why there might be a difference between the segment and chart counts.
Q9) Can I customize my customer groups?
Yes, users can customize their customer group names by using the "Groups" button on the eRFM report page. This feature allows you to tailor group names to better reflect your business's specific customer segments, making it easier to track and target them with relevant marketing strategies.
Q10) What eCommerce source data will be used to calculate RFM scores?
All available source data will be used to calculate RFM scores, including data from APIs, Shopify, Neto, or any other platform that passes transactional data into the Maropost Marketing Cloud. This ensures a comprehensive and accurate calculation of RFM scores based on your customer’s purchasing behavior.
Q11) Can I create segments of contacts using RFM group and Engagement level from any date in the past?
Yes, users can create segments based on RFM group and engagement level attributes from any date in the past. This allows for historical analysis and enables you to track how customer behavior and engagement levels have changed over time, which is useful for retrospective marketing strategies.
Q12) How far can I go to check trends on the eRFM report using the base date and comparison date?
By default, users will see the last 90 days of comparison data on the RFM and Engagement Insights chart. Currently, users can change the comparison date and base date up to 90 days from the present date. However, the Maropost Marketing team is actively working on expanding this feature to allow users to select any date in the past, which will enable deeper trend analysis over a longer period.
Stay tuned for updates on this enhancement.
Q13) How do I set the Recency timeframe, and how does it affect my RFM scores?
You can set your desired Recency timeframe in the eRFM settings. Once set, this timeframe automatically applies to Frequency and Monetary calculations, ensuring a consistent period across all scores.
Q14) Can I use different timeframes for Recency, Frequency, and Monetary scores?
No, to provide accurate segmentation, all three metrics now use the same period based on your Recency setting.
Q15) What if I need to change the Recency timeframe?
You can update your Recency timeframe anytime, and the Frequency and Monetary scores will automatically adjust to match the new period.
Q16) What are customization limits for Recency, Frequency, and Monetary values?
For Recency, the maximum limit is 1000 days. There is no limit on the number of events you can set for Frequency or the dollar amount you can set for Monetary thresholds.
Q17) Does the 90-day date selection restrict my customization options?
No, the 90-day selection is just a default option in the date picker for quick analysis. You can customize Recency (up to 1000 days), Frequency, and Monetary values independently.
Q18) What happens after I save my custom settings?
Once you save your settings, the eRFM report will automatically recalculate scores based on the new definitions, updating customer segmentation to reflect the changes.
Q19) Why can’t I edit the settings immediately after making adjustments?
Once you save new settings, the system recalculates eRFM scores based on the updated definitions. During this recalculation, settings cannot be edited to ensure data consistency. You can still view the report based on the previous settings until the recalculation completes.
Q20) What happens to my report while recalculations are ongoing?
While the system recalculates scores with the new definitions, you can still access the eRFM report with data based on the previous settings. Once recalculations are complete, the updated report will automatically reflect the new settings.
Q21) Can I revert to default settings?
Yes, you can reset your custom definitions to default values if you wish to return to the standard scoring method.