The Dashboard is the first page you'll see when you log into Service Cloud. The dashboard consists of ticket status cards that display your current ticketing queue status at a glance, along with widgets that showcase key metrics in the form of visuals and data.
You can further personalize the dashboard by rearranging the widgets with a simple drag-and-drop.

Note: A personalized dashboard is tied to a user account and is available to the user across multiple accounts.
The following are the dashboard cards and widgets available to you:
Ticket Status Cards
The Ticket Status Cards provide quick insight into the current ticketing queue through the following metrics:
- Unsolved Tickets: Indicates the total count of unresolved tickets.
- Open Tickets: Indicates the total count for tickets in "Open" status.
- Pending & On-Hold Tickets: Indicates the total count for tickets that are in "Pending" or "On-Hold" statuses.
- New Tickets: Indicates the total count for tickets in "New" status.

Ticket Summary Widget
The Ticket Summary widget shows the hourly ticket creation statistics for the current day and the day before.
The metrics are displayed in the form of a curve-line graph. The total counts of tickets received and tickets resolved are displayed in the top-right corner.

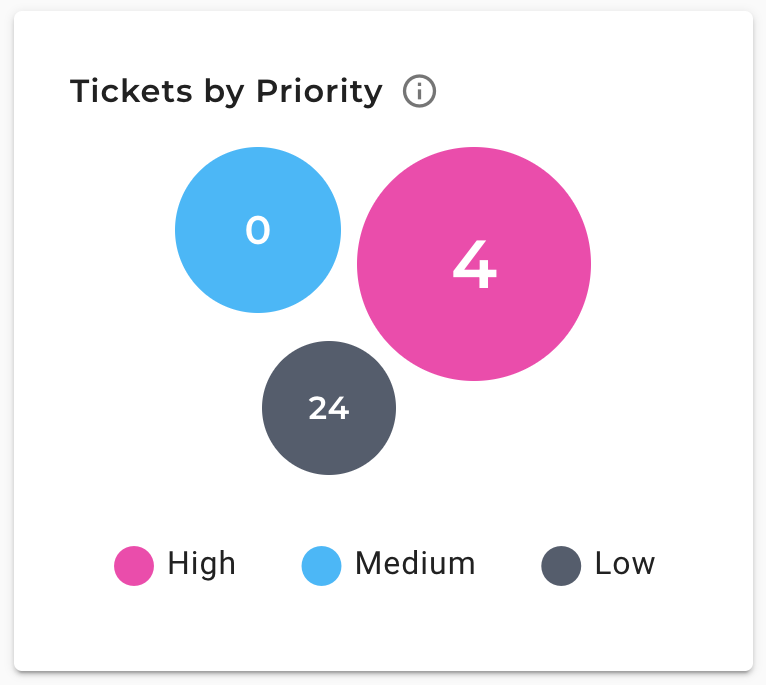
Tickets by Priority Widget
The Tickets by Priority widget shows the number of unresolved tickets categorized based on their priority. The metrics are displayed in the form of a pictograph, in which each circle indicates a specific priority (such as high, medium, or low) and the number in the circle indicates the count of the unresolved tickets.
Tickets by Channel Widget
The Tickets by Channel widget shows the number of tickets received through different channels over the selected period of time. The metrics are displayed in the form of a bar graph, and you can select the period for which you want to see the metrics.

Tickets by Type Widget
The Tickets by Type widget shows the number of unresolved tickets per ticket type. The metrics are displayed in the form of a horizontal bar graph.

Contact Search
The Contact Search widget lets you quickly find contacts with just a few clicks. You can use it to search for both email and SMS contacts.
Contact Search by Email or Phone: To find an email contact, enter their full email address. To find an SMS contact, enter their mobile number in international format: a plus sign (+) followed by the country code, area code, and phone number. If the contact exists, you'll be taken to their contact overview page, where you can view and update their information.
SMS Search Requirements: You can only search for SMS contacts if all of the following conditions are met:
- SMS functionality is enabled for your account.
- SMS functionality is enabled for your user profile.
- A "From Number" has been configured for the account in the Admin panel.
