Quick Engagement Cards
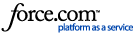
The quick engagement cards enable you to view the important metrics at a glance and include the following:
- Total Sent - Total number of emails sent.
- Total Opens - Total open count indicating the number of times the email was opened.
- Unique Opens - Count of unique opens indicating the number of contacts who opened the email.
- Total Clicks - Total click count indicating the number of times the links in the email was clicked.
- Unique Clicks - Count of unique clicks indicating the number of contacts who clicked the links in the email.
- Conversion Rate - Calculated as total_orders / total_unique_clicks * 100.
- Total Revenue - Calculated as the sum total of revenue from each order for the email.
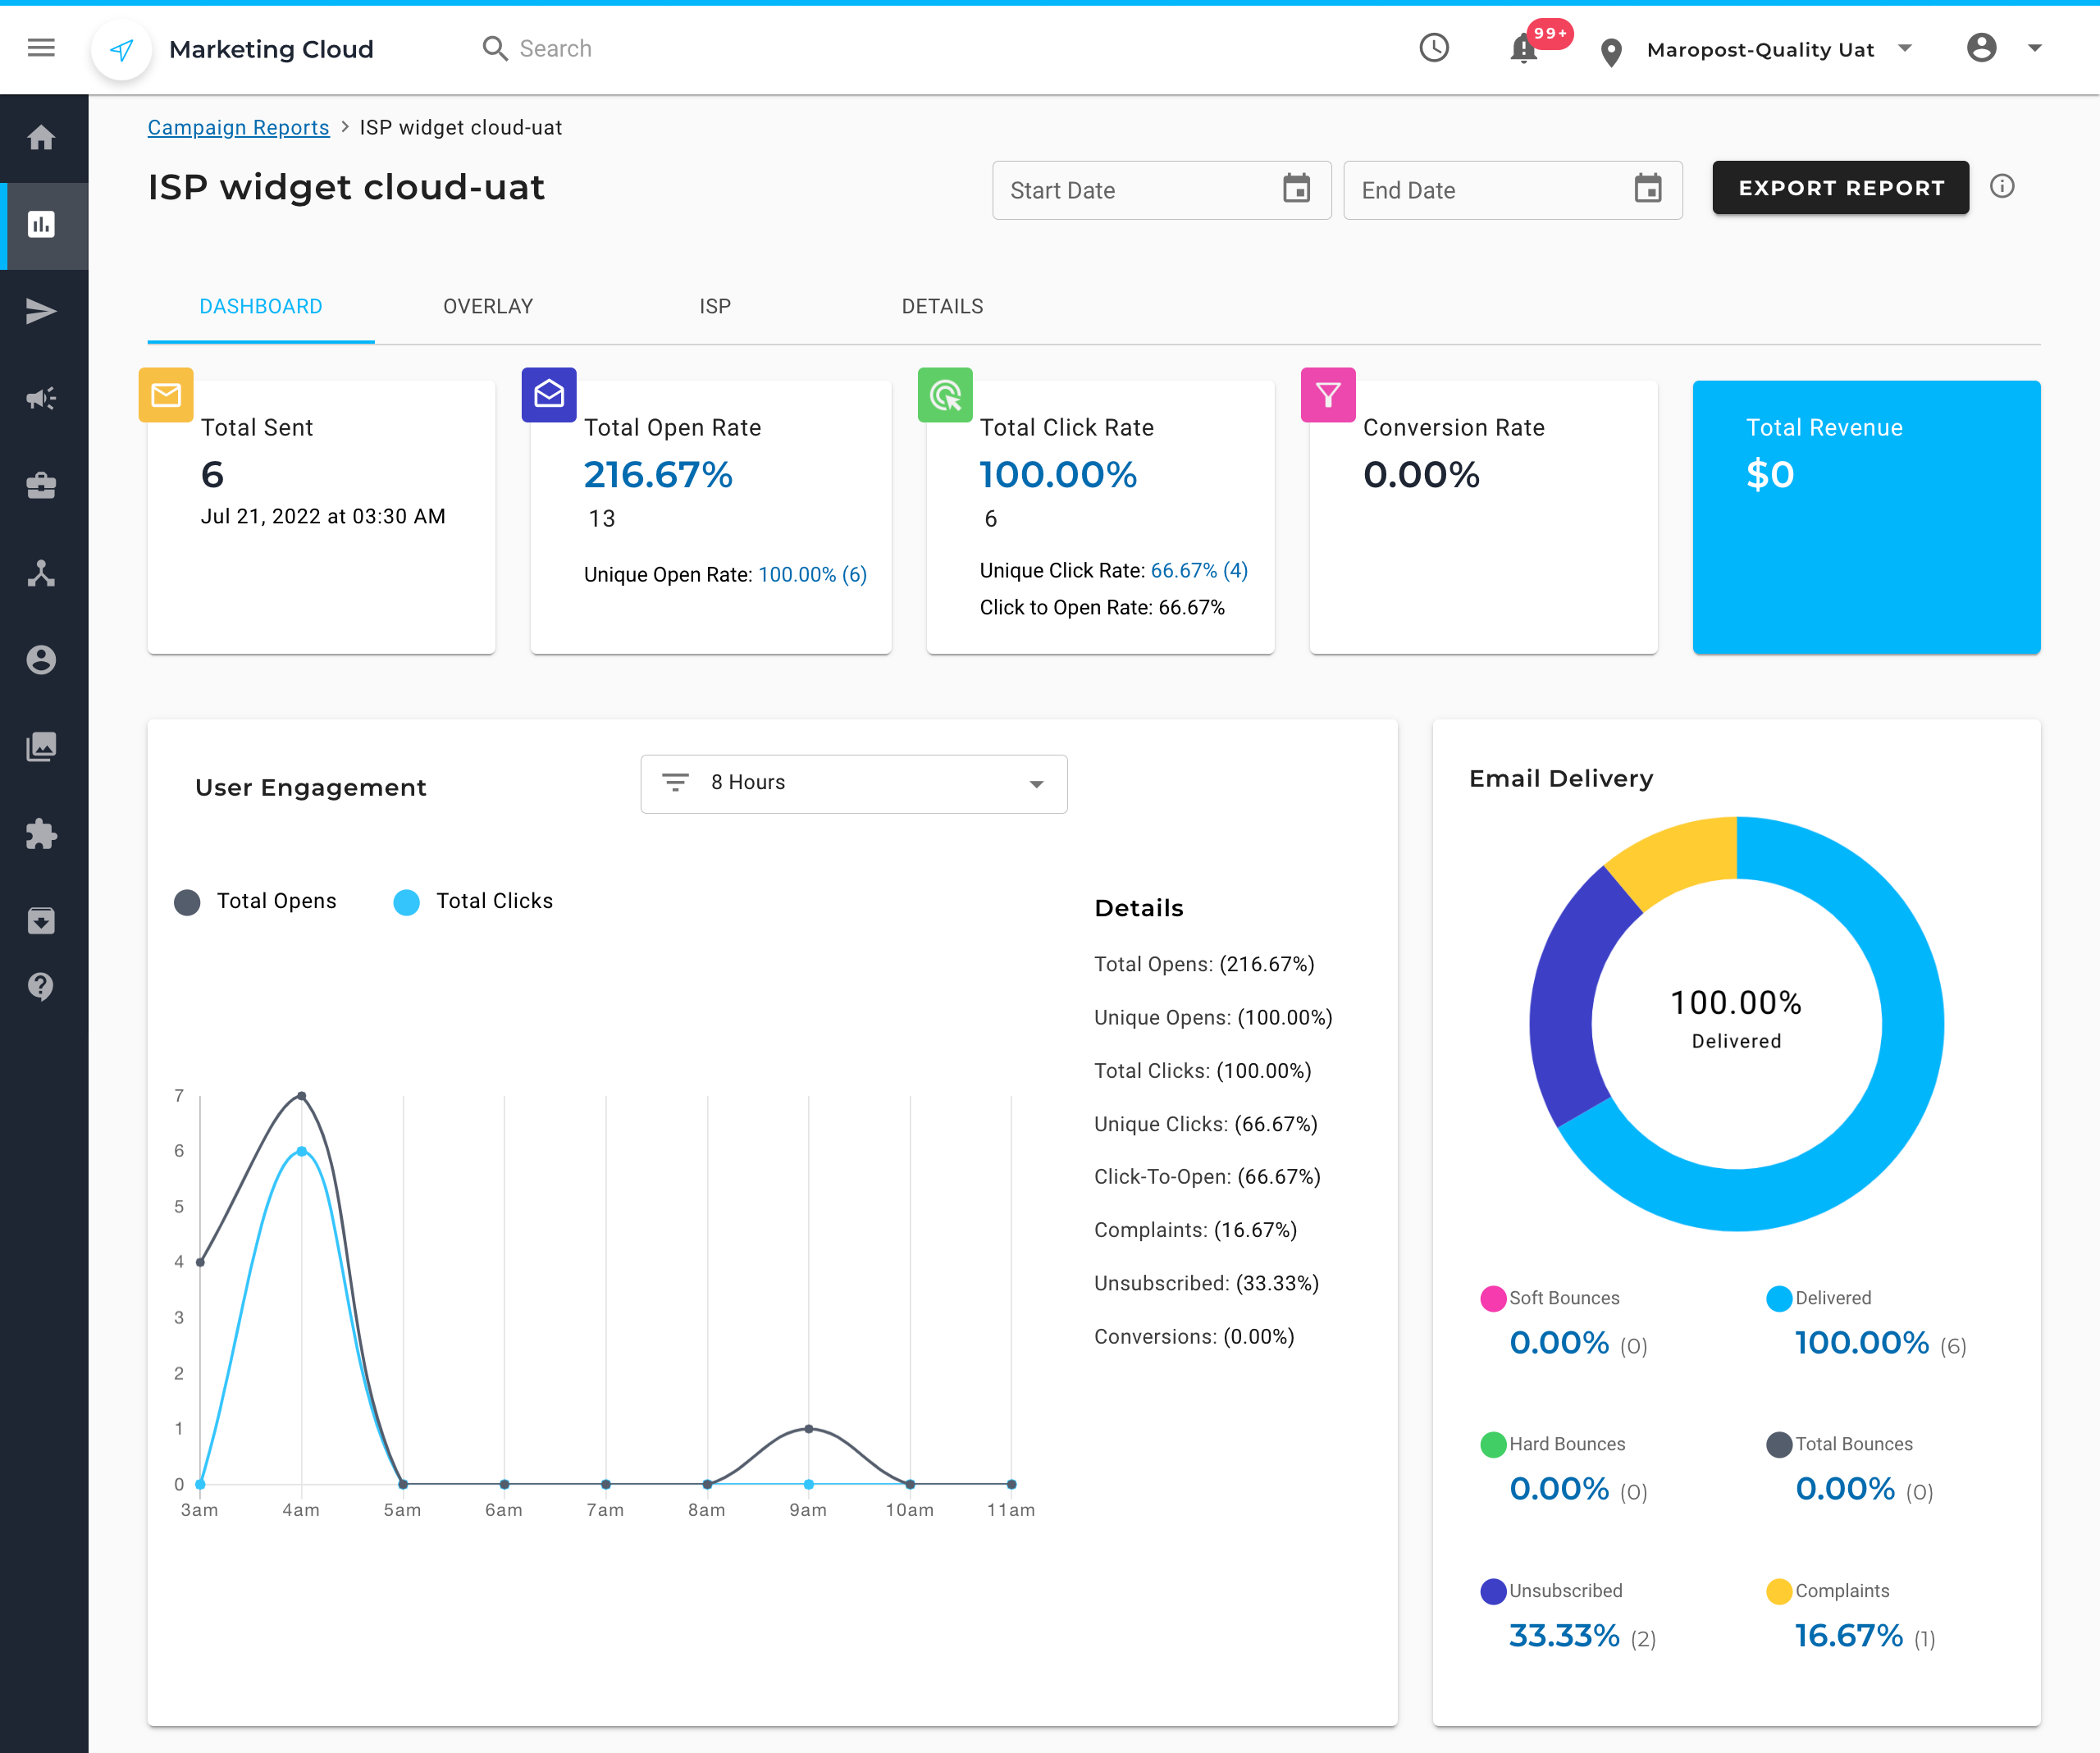
Open Report and Click Report
Click the Total Opens count and Unique Opens count to open their respective detailed report. The detailed report shows the following information:
- Email address and browser/OS/device type that was used to open the email.
- Source, whether it is a data center or a non-data center (other), that opened the email.
- Time at which the email was opened.
Similarly, you can find the detailed report with similar information for Total Clicks and Unique Clicks.
Additionally, for the Apple devices, the detailed report shows the following information:
- Apple MPP Enabled: Indicates Apple device with Apple’s Mail Privacy Protection (MPP) turned ON.
- Apple MPP Disabled: Indicates Apple device with Apple’s Mail Privacy Protection (MPP) turned OFF.
On the detailed reports for Opens and Clicks, use the ‘Exclude Data Center Events’ toggle to filter out the records from data centers to view the specific records originating from your contacts.
You can export the Opens report and Clicks report using the Export button on top of the report. On the exported report, you’ll find the IP address of the data centers in addition to all the information.

Widgets
The widgets provide you with a wider range of metrics and insights in form of charts and graphs enabling you to track and make adjustments to your email campaigns.
User Engagement
The User Engagement widget shows information related to contacts that have opened, clicked, complained, or unsubscribed from the campaign.
- All Opens – The email address, the device used to read the email, and the date the email was read for each contact.
- Unique Opens – The email address, how many times the contact opened the email, the device used to read the email, and the date the email was first to read for each contact.
- All Clicks – The URL of each link in the email that was clicked and how many times the link was clicked. When you click on the URL of any link, you will see the email address, the device used to read the email when clicked, and the date the link was clicked for each contact.
- Complaints – The email address, ISP providing the feedback loop, and the date the spam complaint was received from the ISP.
- All Orders – The email address, the order total, the total number of items ordered, and the order date for each contact.
- Unsubscribed – The email address and date unsubscribed for each contact.
Email Delivery
The Email Delivery widget shows the emails delivered, soft bounced, and hard bounced as a percentage of the total emails sent. Click on a metric along the bottom of the graph to view a drill-down report for that particular metric.
- Delivered – Shows the email address and Date/Time the email was sent to each contact.
- Soft Bounces – Shows the email address, bounce code, description, and Date/Time of the soft bounce for each contact. The soft bounce drill-down report provides very helpful information to diagnose and remediate deliverability issues.
- Hard Bounces – Shows the email address, bounce code, description, and Date/Time of the hard bounce for each contact.
Open By Country
The Open By Country widget shows the open events categorized by the countries from which they were opened.
Email Opens By Device
The Email Opens By Device widget shows the graphical view of the device types (such as Desktop, Mobile, and Tablet) used to read the email.
Web Funnel Report
The Web Funnel Report widget shows the Funnels started, abandoned, completed, and recovered as a percentage of all web funnels tracked. Click on any metric to view a drill-down report for that metric.
📋 Note: This metric is shown only when you have the Web Tracking feature enabled.
Email Opens By Language
The Email Opens By Language widget shows the language preference specified by each contact’s email client that was detected when the email was read.
Coupon Bank Usage
The Coupon Bank Usage widget shows the distributed and redeemed count of coupons that were used in the email.